Why do 83%* of CEOs want their organisations to be more data-driven?
Put simply, because:
“When people across an organisation are empowered with data, they can make better decisions that lead to valuable business outcomes.”
*“How Data Culture Fuels Business Value in Data-Driven Organizations” white paper by IDC in association with Tableau, May 2021.
This need for more (and better) data is one reason why finance teams are changing fast. They still need the technical ability to fulfil their traditional compliance accounting tasks. But, increasingly, they’re also taking on the role of in-house data experts; spotting trends, understanding connectivity and joining the dots.
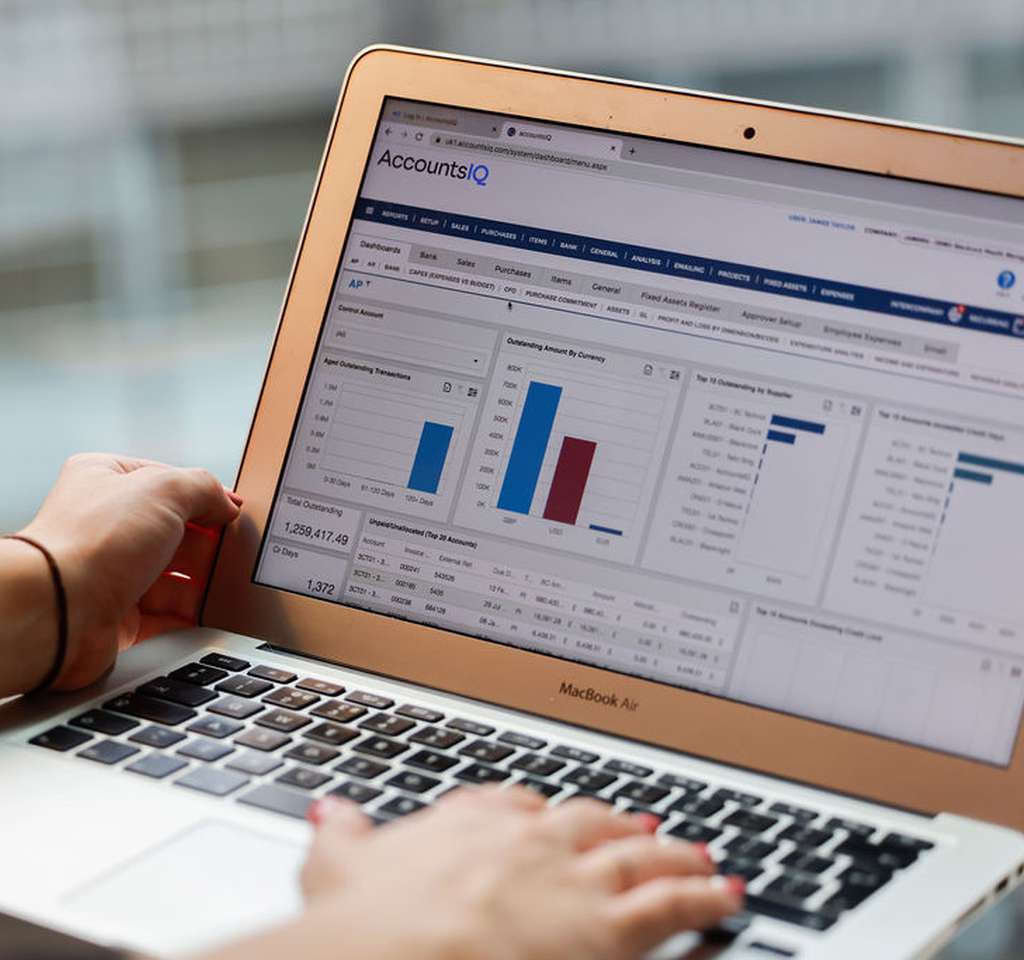
Many customers choose AccountsIQ because they need more detailed, granular business intelligence than their starter accounting system can provide. The demand for management reports from across the business is now so huge, they simply can’t keep extracting data from multiple systems to run cumbersome Excel reports. They need real-time data on performance across multiple variables (such as by group, company, sector, area, department, and project).
Explore our resources and guides to BI coding and management reporting
We’ve pulled together a range of resources to help finance teams effectively use the extensive reporting capabilities of AccountsIQ. They range from webinar recordings that give an introductory overview, to more detailed training videos from our customer e-learning programme, AIQ Academy. There are also some blogs and eBooks, if you prefer reading to watching videos.
It’s everything you need to get started or delve deeper. If you still have questions, please get in touch and we’ll be happy to help.
Getting started
1. Management Reporting webinar recording
In this webinar AccountsIQ’s onboarding and technical specialists give an overview of how monthly and consolidated reporting works in AccountsIQ. They run through some of the most commonly used reports and management account packs and provide useful tips, such as how to use the report filters, search function and create favourites lists. They also introduce the O Data Connector that enables you to connect your entity data (from AccountsIQ and your other business systems) to Excel or PowerBI for powerful KPI reporting.
2. BI Codes & Dimensions
In this webinar we take a more detailed look at BI codes and multi-dimensional analysis. It starts by explaining what dimensions and BI Codes are and how they work. There’s also an in-product demo of AccountsIQ’s up to six-level dimension reporting, how you can add dimensions, and how to slice and dice your data in multiple ways.
Ready to find out more?
AIQ Academy is our e-learning portal. The full training programme is available to all our customers at no extra cost. If you’re not yet a customer, here are links to some of our reporting and BI coding videos to give you a flavour of what AccountsIQ can do for your finance and management teams.
1. Management reporting
Reporting Tools (3 minutes)
Report Manager (4 minutes)
Commonly used Reports (8 minutes)
Consolidated Reporting (6 minutes)
2. BI Codes and Dimensions
BI Analysis Overview (4 minutes)
BI Reporting (5 minutes)
Prefer to read rather than watch?
Download our eBook: Group Finance Reporting: Finding a Single Version of the Truth.
Read our blog: How BI Codes Improve Financial Reporting.
Check out our case studies for real-world examples of how AccountsIQ customers are using multi-dimensional analysis and reporting. You can filter the list by industry sector to find a relevant example for your business. For example:
The finance team at The Irish Times Group save valuable time by doing their monthly reporting with AccountsIQ. The detailed business intelligence also gives their management team greater control over the business. The Group’s Managing Director, Mikie Sheehan explains:
“AccountsIQ is intuitive, so it’s easy for me to run a report or get a quick snapshot of performance at any stage throughout the month. Personally, I have more visibility, I can ask more questions, I can drill down into the detail and it’s simple to do all this in AccountsIQ. It has made a real change to our reporting processes. The consolidation functionality is also a huge asset within the system and significantly reduces month-end close to allow us to get that Group view immediately.”
Still have questions?
Get in touch. We’re happy to explain our analysis and reporting features in more detail and discuss your individual requirements.
Join us at our next live webinar
Our next live webinar will be a coffee break demo of AccountsIQ. Our Business Development Manager, Andrew Faulkner, will cover:
- Save hours on repetitive tasks by automating key processes.
- Get deep multi-dimensional analysis and business intelligence.
- Automate multi-currency consolidation.
- Collaborate better with our workflow approval app.
- Scale up - add subsidiaries & multi-currency transactions at speed.
- Connect your business applications to speed up monthly close and analysis.
Thursday 13th Oct 11:00AM (30 minutes).
Reserve my place at the coffee time demo.


