AccountsIQ's enhanced BI coding structure allows you to tag all your company’s transactions to specific projects, divisions, cost centres, departments, locations or funds. It’s completely flexible, so you can customise up to six dimensions for each BI entity based on your own business needs and get the financial reporting insights you need.
‘Business Intelligence (BI) Code’ is a proprietary AccountsIQ term that describes any business ‘entity’ in your organisation. That entity could be a department, location, activity, asset or project; it’s not restricted to legal entities, such as limited companies. Many accountants may be more familiar seeing ‘BI code’ described as ‘department code’.
Our BI coding and six dimensions structure enable you to gain detailed insight into the financial performance of all the operational elements across your organisation, quickly and easily. By prioritising clear, detailed, and real time analysis, senior managers can make better, faster and more informed decisions.
Key points about BI codes in AccountsIQ’s cloud accounting platform:
- BI codes are simply capture codes
- They enable multi-layered data analytics
- You can also track, analyse and report at group level
- The set up can flex to meet your reporting needs
- You can align the BI mapping with your other business systems
- They can be used as a tagging mechanism to isolate transaction types
Our BI coding structure enables detailed business analysis
We’ve designed our BI coding structure to enable you to analyse your business performance in numerous ways. The analysis you gain goes way beyond the standard, single company-wide Profit and Loss, Sales and Balance Sheet view. You can quickly compare the performance of different:
- Locations or branches
- Customer categories, such as retailers, wholesalers or Internet resellers
- Departments or departments within each location
- Product types
- Activities, such as Sales, Marketing and Operations
- Projects
- Funds or Special Purpose Vehicles (SPVs).
With AccountsIQ, you can analyse your business performance in many different ways. You can set up specific business entities as “Business Dimensions.” AccountsIQ enables you to set up to six Business Dimensions, such as Locations, Customer Categories, Departments, Products, Activities or Projects. For example, if you set up Location as a Dimension, you can then allocate unique BI codes to all your Locations within that Dimension to identify each one.
How do customers benefit from using BI codes?
Customers use AccountsIQ’s 3-level GL structure and BI layer to produce accurate reporting for detailed, granular analysis.
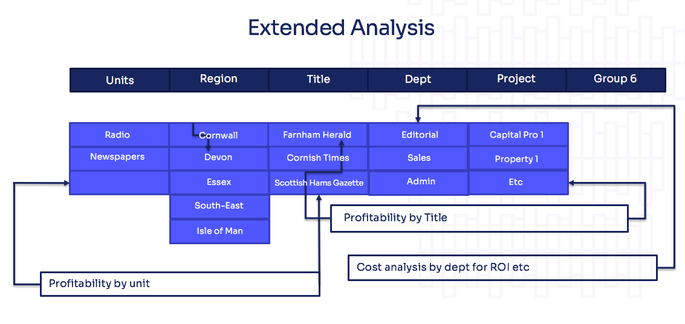
For example, Tindle Newspaper Group is currently using four dimensions: Entity, Division, Publication and Department. They find it quick and easy to slice, dice and customise reporting across all these dimensions. They can also add new dimensions, such as Property, to monitor and analyse capital spending. See example below:

Discover How this CFO digitally transformed Group Finance | AccountingWEB.
As Tindle’s Group Finance Director, Alastair Manson, explains:
We have a baseline process for reporting and the commercial insights are really useful. For example, we can drill down to obtain separate P&Ls for each region. We can even look at each publishing centre within each region.”
Read the Tindle Newspaper Group case study to see how AccountsIQ BI codes help them achieve multi-dimensional, consolidated management reports.
Delivering insight: the right management reports at the right time with valuable information
Today’s boards and senior leaders have a thirst for insights that enable them to make good decisions. They want financial reports that provide transparency and act as an early warning system for both business risks and opportunities.
However, too many finance teams still spend too much time on low value-added activities. Often, they struggle to translate raw data into useful, user-friendly reports. But it doesn’t have to be that way.
With AccountsIQ, you can:
- Choose from a suite of around 300 pre-configured management reports
- Create your own bespoke reports
- Access real-time data direct from the dashboards
- Produce detailed reporting packs in minutes
- Consolidate your data and report across your Group in one-click
- Communicate in-depth analysis in interactive charts and KPIs
- Turn your finance team into your board’s trusted business adviser.
Watch our 4-minute overview video of how AccountsIQ BI coding enables detailed financial analysis.
Find out more about how to get incredible Business Intelligence with accounting, consolidation and management reporting all in one AccountsIQ platform or book a demo.


