What's keeping CFOs up at night?
We reveal the key issues facing finance leaders in the UK&I, including 86% feel decisions about financial strategy are made without sufficient data or insight.
x
We reveal the key issues facing finance leaders in the UK&I, including 86% feel decisions about financial strategy are made without sufficient data or insight.
.svg)

.png)
A CFO’s guide to simplifying multi-currency consolidation - why it matters, where it gets tricky, and how smart automation can transform your group reporting

If you’re heading up the finance function for a group of companies—particularly those spanning across borders—you’ll know that multi-currency consolidation is far from a routine admin task. It’s a strategic necessity.
In today’s evolving landscape, where even mid-sized businesses operate across multiple jurisdictions, the pressure to deliver fast, accurate and meaningful consolidated reports has never been higher. But the job’s rarely straightforward. Exchange rate fluctuations, inconsistent local rules, and systems that don’t quite sync—that’s enough to make even the most fearless CFO wince.
That’s exactly why forward-thinking finance teams are turning to cloud platforms that take the heavy lifting out of consolidation. Automating the nuts and bolts of multi-entity reporting doesn’t just save time; it sharpens the strategic edge of your entire finance function.
Let’s take a closer look at how to get it right.
In a nutshell, it’s the process of combining the financials of entities operating in different currencies into a unified set of group accounts.
Whether you’re a UK-based firm with Irish and European subsidiaries, or a global business managing teams in five time zones, consolidated reporting allows you to get the full financial picture of your operations. It’s vital for everything from statutory compliance and investor updates to long-range planning and performance benchmarking.
Done properly, it gives leadership the clarity and confidence to move quickly—whether that’s launching into a new market or navigating volatility.
Depending on where you’re operating, you’ll be working under IFRS (with IAS 21 and IFRS 10 doing most of the heavy lifting) or US GAAP (particularly ASC 830 and ASC 810). While the principles are broadly aligned, there are some key differences worth noting—especially when it comes to things like functional currency determination, exchange gains/losses, and how intercompany balances are eliminated.
For example: IFRS tends to push exchange differences through other comprehensive income, while US GAAP has different treatment under the temporal method.
But for most group finance teams the real challenge isn’t picking the right standard—it’s ensuring it’s applied consistently across all your entities, regardless of local quirks or software setups.
There are two main ways to handle currency translation during consolidation, and using the wrong one (or applying it inconsistently) can create real headaches.
Used when a subsidiary operates independently in its own local currency. Balance sheet items are translated at the closing rate, income statement items at the average rate, and any differences get parked in equity—not P&L.
This one comes into play when a subsidiary’s functional currency matches the parent’s. Monetary items are translated using closing rates, but non-monetary items stick with the original historical rate. Any resulting gains or losses flow through the P&L, which makes accurate tracking of historical rates a must.
Each method has its place. Getting this right means aligning translation policy with your actual business reality, rather than just ticking a compliance box.
Even with the right policies in place, consolidation across currencies introduces friction at almost every step. You might find yourself asking:
It’s easy to underestimate just how much time your team spends grappling with these issues—especially if your tools aren’t up to scratch. Spreadsheets, no matter how strong your superpowers may be, are still prone to version control issues, manual error, and being a massive drain on your and your team’s time.
If your month-end is dragging its feet, chances are the rest of the organisation is making decisions based on outdated or incomplete data.
This is where a smart, purpose-built solution like AccountsIQ comes in. Automation doesn’t just simplify the process; it strengthens the foundations of your group reporting.
Built-in exchange rate tables, auto-elimination of intercompany entries and clear audit trails mean less time crunching numbers, and more time delivering insights. With a system that applies your translation rules consistently, every single time, you take the guesswork (and inconsistency) out of consolidation.
It also frees up your team to do more impactful work. No more repetitive spreadsheet headaches. Just reliable, accurate numbers delivered on time, every time.
When your consolidation is automated, your reporting can become far more insightful. AccountsIQ lets you cut through the noise with multi-dimensional views—by entity, currency, region, department, or cost centre.
Want to know how a weaker euro affected your margins in Q1? Or look into how FX impacted EBITDA across your group? We give you the tools you need to get those answers fast, and present them clearly to your leadership team or board.
It’s a game-changer for businesses that want to lead with data, not just report on it.
Exchange rates don’t stay still. And in volatile markets, even small fluctuations can seriously affect group results.
Modern accounting systems let you build FX sensitivity analysis and scenario planning right into your forecasting process. Budget in local currencies, consolidate in your reporting currency, and model potential impacts of rate changes without duplicating work across dozens of files.
This kind of visibility is essential for finance teams looking to move from reactive reporting to proactive, strategic planning.
Consolidated group reporting also comes with disclosure requirements, whether it’s explaining your translation methodology or presenting accumulated exchange differences. Regulators and auditors expect a clear, transparent approach—and rightly so.
With the right platform, you’ve got built-in controls, consistent application of policies, and the ability to produce documentation quickly when it’s needed. That’s a win not just for compliance, but for audit-readiness and internal control too.
You don’t need to have a global presence to justify better tools. In fact, if you’re scaling quickly or operating in more than one currency, the risk of doing nothing only grows over time.
If your team is spending days consolidating reports, triple-checking exchange rates, or untangling intercompany transactions by hand, something needs to change.
Cloud platforms like AccountsIQ are tailor-made to tackle this kind of complexity—without adding overhead. With native multi-entity consolidation, automated currency translation and intuitive dashboards, your finance team can finally break free from the bottlenecks.
Ready to see what better looks like? Explore AccountsIQ’s reporting features and discover how effortless multi-currency consolidation can really be.

Finance teams chase missing receipts weekly for one in three employees, survey reveals
UK finance teams are spending increasing time chasing missing receipts and untangling incomplete expense data, with 1 in 10 (10%) of employees contacted daily and nearly one-third (28%) chased weekly. That’s according to new research by ExpenseIn, part of the AccountsIQ Group.
The survey of 500 UK-based employees reveals almost half (49%) still use their own money for work purchases before claiming back expenses, while only 19% have access to a company expense card. This outdated approach leaves finance teams juggling multiple disconnected tools and dealing with slow and difficult expense processes. In fact, 28% describe their expense management as time-consuming and manual.
To tackle these persistent challenges, ExpenseIn has today launched its ExpenseIn Card, a smart, fully embedded business card designed to replace disconnected corporate card programmes. Integrated seamlessly within the ExpenseIn platform, the card brings real-time visibility, streamlined receipt capture, and automated policy checks to finance teams, reducing the need to chase employees and accelerating approval workflows.
.webp)
Richard Jones, Managing Director of ExpenseIn, commented: “Most traditional corporate cards weren’t built with finance teams in mind. They make it hard to set controls, see spend as it happens, or connect card usage with the rest of your expense process. With the ExpenseIn Card, everything happens in one place. You issue a card, set the rules, and every transaction flows through with the receipt and policy checks already in place.”
Darren Cran, CEO of AccountsIQ also commented: “What we really value about the ExpenseIn integration is how seamlessly it handles the entire expense journey - from the moment an employee taps their card to when the data lands in AccountsIQ. It frees up our finance team to focus on higher-value work like spend analysis, VAT recovery, and strengthening policy controls. And the best part? Our team genuinely loves using the cards.”
The ExpenseIn Card eliminates the frustration of employees paying out of pocket – a top concern cited by 38% of employees - and addresses the demand for simpler receipt submission (39%). When employees make purchases with the ExpenseIn Card, transactions are captured instantly, receipts uploaded on the spot, and draft expenses pre-filled and ready for quick approval. Finance teams benefit from real-time spend oversight without waiting for month-end reconciliations or chasing missing paperwork.
Designed to slot effortlessly into existing finance stacks, each transaction flows automatically through approval chains and syncs with accounting software like AccountsIQ, Sage, Xero, and QuickBooks — eliminating manual exports and duplicate data entry.
To learn more about ExpenseIn’s smart corporate card and its benefits for finance teams, visit their website here.

Month-end. These two little words have the power to send a shiver down the spine of the most experienced finance professionals. And we all know why.
Month-end. These two little words have the power to send a shiver down the spine of the most experienced finance professionals. And we all know why.
It’s a time-consuming, stress-inducing cycle of hunting down numbers, finding and fixing errors, and compiling reports. All too often, it becomes an intense race against the clock while trying to keep up with the day-to-day.
But what if you could cut the time it takes to close the books by 50%? What if you could do that with fewer errors and better insights? Well, buckle up because automation isn’t just another buzzword. It’s a real solution to the problem of drawn-out month-end closes.
We’re equipping the office of the CFO of the future, and the tools you need to help you save time and ease the pressure on your team are already here. Let’s take a closer look at the how and why behind simplifying your month-end close.
The month-end close isn’t just a compliance task. It’s the heartbeat of financial strategy. When this process is slow or error-prone, it delays everything from performance reviews to critical investment decisions.
A drawn-out close cycle can:
In an environment where agility is everything, real-time financial close solutions can be a game-changer.
Traditional month-end processes have relied heavily on manual inputs, spreadsheets, and siloed systems. That can only lead to two things: bottlenecks and a burnt-out team. The most common pain points include:
In larger or fast-growing companies, these problems multiply, especially when dealing with multi-entity accounting. Automation becomes less of a luxury and more of a necessity.
Accelerating the month-end doesn’t just ease operational pressure. It sharpens your competitive edge. When you can access financial insights faster, you’re better positioned to act on them. That could mean adjusting spend, identifying emerging risks, or jumping on opportunities your competitors haven’t seen yet.
A faster, cleaner close also builds trust—both internally and externally. Stakeholders, regulators, and investors expect timely, accurate data. Automation helps you meet those expectations consistently.
The accounting software you choose is key here. That’s where AccountsIQ’s intuitive month-end close automation software tackles the process end-to-end, with a keen focus on these core areas:
With a cloud-native platform, your finance team can work anytime, anywhere. That’s a must for hybrid or globally distributed teams. Real-time data processing eliminates version control issues, and scalability ensures your system grows with your business.
Know exactly where each task stands with built-in workflow tools. From automated task allocation to deadline alerts, it keeps the month-end close on track. Approval flows and visual dashboards add structure without slowing things down.
Forget chasing missing data or manually correcting errors. AccountsIQ integrates with your other business systems and validates data as it enters the platform. That means fewer errors, less backtracking, and more trust in your numbers.
Salamanca Group manages around 80 entities in total, and used to spend two full staff weeks every month updating spreadsheets and preparing management reports. Their month-end close was manual, slow, and prone to errors.
After making the move to AccountsIQ, consolidation now takes minutes instead of weeks, and management reports are generated instantly from live data. Finance Director Lee Camp sums it up nicely:
“Our decision to move away from Sage Line 50 was driven by inefficiencies which Sage couldn’t address; it took two people in my team one week each to update various schedules in Excel and then I would spend many hours compiling a reporting pack. AccountsIQ allows me to produce a custom reporting pack in just minutes.”
Intrigued? You can get the full details of how automation transformed Salamanca Group’s processes over on their case study page.
Let’s say you’ve got those numbers in. Next, AccountsIQ turns them into actionable insights. Here’s what that looks like in a nutshell:
You don’t need a full-scale transformation project to start feeling the benefits. Here’s how you can take action without overwhelming your finance function:
Companies using AccountsIQ regularly report cutting their close cycle by up to 50%. That’s more time for strategic thinking and less time spent wrangling spreadsheets.
And it’s not just about speed; it’s about better, more reliable results. With less room for errors, stronger controls, and richer data insights, your finance function can shift from reactive to proactive.
Time to revamp your month-end? Better begins now. Start by mapping out your manual processes and identifying areas for improvement. Next, look at solutions that actually suit your team, rather than doing things the other way around.
We’ve also created a handy, bite-sized guide to help you explore how AccountsIQ simplifies multi-entity reporting and delivers insights that go above and beyond the basics.
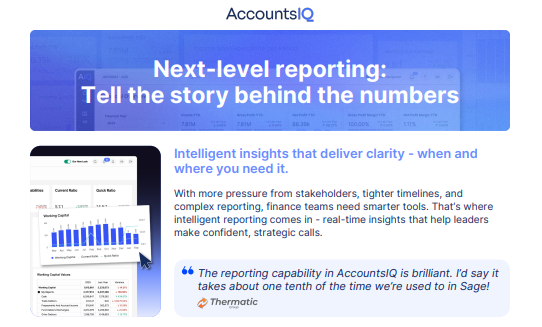
Whether you're prepping for your next board meeting or tracking KPIs on the go, our latest guide shows how real-time dashboards, flexible reporting structures, and smart automation give you instant clarity—minus the manual faff.
From one-click consolidation to drill-down reports, this quick read covers the key features finance teams love most.
👉 Download the Next-Level Reporting Guide to see how better reporting begins now.

AccountsIQ will also power Triathlon Ireland’s My Tri Ranking pages in 2025 and 2026.
Dublin, Ireland; 6th May 2025: Triathlon Ireland, the national governing body for triathlon and multisport in Ireland, has today announced AccountsIQ, a leading provider of advanced financial management software, as its new Finance and Insights Partner.
With AccountsIQ’s finance software, Triathlon Ireland will streamline its financial and operational workflows and improve efficiency, accuracy and scalability. By removing the need for manual data reconciliation, the organisation can benefit from enhanced reporting, better decision-making and empowering the team to focus on higher-value activities.
In addition to the partnership, AccountsIQ will also power Triathlon Ireland’s My Tri Ranking Ireland pages for 2025 and 2026, further strengthening the collaboration between the two organisations. The My Tri Ranking initiative provides participants with a platform to track their personal achievements and progression in the sport as well as providing the all-important rankings for the Triathlon and Duathlon National Series.
AccountsIQ and Triathlon Ireland’s partnership is founded on a shared belief in the power of data, insights and performance. Both organisations recognise the parallels between financial management and elite sport, where accurate data and actionable insights are crucial to achieving success at both corporate and athlete levels.
This new agreement strengthens an already close relationship: Triathlon Ireland has partnered with ExpenseIn, part of the AccountsIQ Group, since 2018 to manage its expenses and streamline financial processes.
Darren Coombes, CEO at Triathlon Ireland, commented: “We are delighted to welcome AccountsIQ Group on board as our new Finance and Insights Partner. Data is a key element for us as an organisation, as well as for our triathlon community who utilise the numbers to gauge performance at all levels.
“As a long time user of ExpenseIn to track our expenses, there is a natural synergy between our organisations,” Coombes continued. “I'm really excited to see our partnership develop and what we can achieve together over the next two years. AccountsIQ is also going to be powering our My Tri Ranking pages going forward, an increasingly important area for our sport in providing accurate and timely updates for the Triathlon and Duathlon National Series as well as athlete rankings.”
Darren Cran, CEO of AccountsIQ, added: “This partnership is the latest for AccountsIQ with National Governing Bodies (NGBs) in the sports sector, adding to our relationships with Hockey Ireland, Athletics Ireland and more. Data sits at the core of success, whether in business or in sport. Accurate insights enable better decision-making, stronger performance, and more effective strategies. As a committed triathlete myself, this partnership is particularly meaningful to me. It’s fantastic to support an organisation that empowers athletes at every level to achieve their goals, while also equipping its internal teams with the financial tools they need to thrive.”
ENDS
Triathlon Ireland is the National Governing Body for one of Ireland’s most dynamic and inclusive sports. Since the first triathlon event was held in north Co. Dublin in the early 1980s, the sport of triathlon has experienced unprecedented growth to the extent that Ireland now ranks fifth in the world for participation rates in triathlon per capita.
From its roots as a sport for the ultra-fit, triathlon has become a mass participation activity for all ages and abilities. Each summer over 10,000 people take part in the Triathlon National Series, making it the largest endurance sport league nationally.
AccountsIQ delivers advanced financial management solutions to meet the accounting and business needs of ambitious mid-market companies with a growth mindset. Providing automated processes that increase productivity, group accounting features and next-level business intelligence, AccountsIQ offers finance leaders an easy route to digital transformation, with technology that streamlines their workflows and enriches their lives. With a go-live period 5x faster than competitors, AccountsIQ stands out in the market as an easy-to-use, cloud-native platform that delivers next-level insights and empowers better business decisions and faster results. Headquartered in Dublin with a second office in London, the business has over 100 employees and supports over 35,000 users worldwide.

It’s time to get out of the spreadsheet trap and level up to something smarter, faster, and more future-proof. Something to empower your team to reach their full potential.
Excel has been the go-to for finance professionals for as long as anyone can remember. It’s flexible, familiar, and seems to be able to handle just about anything you throw at it if you know the right formulas.
But here’s the catch: while spreadsheets no doubt have their place, they no longer measure up to the demands of modern financial reporting. As the role of the CFO continues to expand, so too does the need for sophisticated, yet easy-to-grasp insights when it comes to reporting.
There’s also a time element to consider; finance teams pushing for real strategic impact simply can’t afford to spend hours bogged down in manual inputs and hunting for error-prone workarounds.
It’s time to get out of the spreadsheet trap and level up to something smarter, faster, and more future-proof. Something to empower your team to reach their full potential.
Excel has been a lynch pin of finance teams for decades. In fact, research shows that over 70% of companies still lean on spreadsheets quite heavily when it comes to budgeting, forecasting, and consolidation.
Why? Its accessibility and user familiarity have helped it thrive across finance departments all over the world.
But the software is not without its issues. As organisations scale, so do their data volumes, reporting needs, and compliance requirements; things Excel just isn’t designed to manage at the enterprise level.
2. The hidden costs of spreadsheet dependency
Every extra minute spent updating formulas, cross-checking figures, or manually consolidating data is time your team could spend on something more impactful.
Productivity takes a hit. Errors tiptoe their way in. You don’t want your highly skilled finance professionals to be stuck doing tedious, repetitive work; your resources should be focused on mission-critical tasks and strategic initiatives.
And the cost attached to spreadsheet-related errors is just staggering. Businesses have suffered multimillion-pound losses as a result of simple copy-paste mistakes or overlooked formula issues. Ouch.
3. Pain points you know all too well
If your team is wrestling with multiple spreadsheet versions, struggling with version control, and constantly having to root out inconsistent data, you’re not alone. Excel-based reporting is rife with a number of annoying issues, such as:
Even a tiny formula error can have huge knock-on effects, from distorted forecasts leading to shaky decision-making, to actual compliance failures.
And we’ve seen in the headlines how spreadsheet errors have led to stock misvaluations, reporting inaccuracies, and major regulatory fines. For example, in 2024, Thyssenkrupp Materials Ltd were hit with an unexpected £8 million tax bill after submitting incompatible "bills of discharge" to HMRC.
The source of the issue? Excel spreadsheets. An error in manually updating a spreadsheet led to the submission of incorrect data, resulting in significant financial repercussions.
Shared spreadsheets aren’t just inefficient—they’re not secure. Without the right access controls, audit trails, or encryption, sensitive financial data is very much at risk. With cyberthreats coming thick and fast, and AI-powered attackers looking for that kind of vulnerability, companies need their data locked down.
And it’s not just about keeping your data safe; there’s GDPR, SOX, and other compliance frameworks to consider, too.
Need to stress test your financial models? Plan for multiple scenarios? Excel just doesn’t cut it. It’s not built for systematic risk analysis, and attempting to force it into that role creates unreliable outputs and painful bottlenecks.
Modern finance teams are making the move to cloud-based financial consolidation tools and cloud-native financial planning and analysis (FP&A) software to overcome spreadsheet limitations. These tools don’t just replace Excel—they reimagine how finance works:
This isn’t a ‘nice-to-have’ anymore, but a strategic upgrade that you need if you want to keep pace with the competition.
Today’s advanced reporting tools offer:
With centralised data management, data governance frameworks, and built-in quality controls, these platforms provide the clarity and control that spreadsheets simply can’t.
The best solutions don’t exist in isolation. They integrate with your ERP, accounting software, payroll systems, and BI tools—creating an ecosystem where data flows freely, workflows are automated, and reporting is no longer a reactive scramble.
Automating manual processes and ditching the repetitive spreadsheet tasks makes for faster period closes, less stress at month-end, and more time for high-impact work. It’s a no-brainer.
With real-time insights, improved accuracy, and more granular analytics, finance becomes your strategic partner. You’re empowered to drive smarter business decisions, more accurate forecasts, and responsive planning.
Cloud platforms allow multiple team members to collaborate in real-time. No more version conflicts. No more email chains with conflicting data. Just clean, up-to-date, accessible information—shared across finance, operations, and leadership.
Need to handle growing data volumes? Pivot to a changing business model? Modern platforms are designed to adapt. Whether you’re moving into new markets or restructuring, they can flex with you without breaking a sweat.
Start by mapping your spreadsheet usage. Identify critical reporting processes and areas most prone to error or inefficiency. That’s where the business case builds itself.
Measure twice and cut once, as the saying goes, so do your due diligence before making the move. Remember, not all tools are created equal. Look for:
And check out the total cost of ownership, not just license fees. Think about time saved, errors avoided, and agility gained.
Roll out your new platform in phases, starting with pilot reports. Run your systems in parallel, and upskill your team so they’re empowered to use that software and make the most of it. Oh, and embed change management best practices to ensure buy-in and adoption.
Set clear KPIs to measure success; be sure to include things like time savings, error reduction, report turnaround speed, and decision-making accuracy. Then, let the results do the talking.
Like a favourite pair of walking boots, Excel has served us well. But it’s no longer enough. For finance leaders looking to lead, not lag, now is the time to make the move.
With cloud-based financial consolidation tools and real-time cloud reporting, you don’t just escape the spreadsheet trap, but unlock a whole new level of performance.
Start your transformation today. We’re here to help you move from manual to modern seamlessly, securely, and strategically.
Find out more about how better begins now with AccountsIQ’s cloud solutions.

With 38% of CFOs highlighting the importance of better financial technology, the need for integrated, real-time financial solutions is clear. CFOs must move from reactive financial management to a more proactive, data-driven approach, one that can provide both a comprehensive overview of finances and granular, real-time insights to stay ahead of the curve.
CFOs in the property sector are facing unprecedented challenges as they work to drive growth while maintaining financial control. From rising operational costs and unpredictable cash flows to increasing regulatory pressures, property management is an inherently complex space. According to research from our recent CFO Mindset report, 76% of CFOs feel they don’t have full control over their organisation's financial health. This lack of oversight, coupled with the rapid pace of market changes, is putting immense pressure on CFOs, forcing many to seek better tools to regain control.
With 38% of CFOs highlighting the importance of better financial technology, the need for integrated, real-time financial solutions is clear. CFOs must move from reactive financial management to a more proactive, data-driven approach, one that can provide both a comprehensive overview of finances and granular, real-time insights to stay ahead of the curve.
The complexities of portfolio management: Juggling multiple entities and inconsistent cash flows
Property portfolio management is complex. For many CFOs in the sector, this involves overseeing multiple entities – Special Purpose Vehicles (SPVs), Special Purpose Entities (SPEs), and real estate investment trusts (REITs) – while keeping track of fluctuating revenue streams and unpredictable costs. Managing these complexities means CFOs must reconcile financials across different companies and entities, often in different regions or markets, all with varying financial reporting requirements.
Cash flow volatility is another ongoing challenge. Rent collection, service charges, maintenance costs, and the need to provision for vacancies all impact financial stability. Rising interest rates, inflation, and increasing regulatory complexity make this even more difficult to manage. Without the ability to consolidate financial data seamlessly and access it in real-time, it becomes increasingly difficult for CFOs to maintain control over their financial position and plan strategically for growth.
Why real-time data and financial visibility are critical to success
At the heart of these challenges lies the need for real-time visibility into financial data. To make informed decisions, CFOs need immediate access to consolidated data across multiple entities, properties, and portfolios. 38% of CFOs in our research agree that having access to better financial technology is key to improving oversight, while 35% believe artificial intelligence (AI) could be a game-changer in streamlining decision-making.
By moving to an automated, cloud-based solution that integrates with existing property management systems, CFOs can gain quicker, more accurate insights, enabling faster decision-making in a volatile market. Real-time visibility ensures that CFOs are not just reacting to market changes but can proactively adjust strategies, reduce risks, and drive long-term growth.
The financial management solution: Automation, scalability, and quick implementation
So, what do CFOs need from their financial management software to overcome these hurdles?
1. Multi-entity management: Managing multiple entities within a single platform is essential for property sector CFOs. Whether overseeing SPVs, REITs, or other property-related structures, the software must simplify financial consolidation and offer a complete, integrated view of financial health across entities. This ability ensures smoother decision-making and less time spent juggling systems.
2. Automation for efficiency: Reducing manual processes is paramount. Automation eliminates human error, cuts down on time spent on routine tasks (like VAT reporting, fixed asset management, and invoice processing), and frees up the finance team to focus on more strategic initiatives.
3. Cloud-based scalability: As businesses scale, CFOs need software that can grow with them. Cloud-based financial systems provide flexibility, allowing CFOs to manage finances from anywhere, at any time, while seamlessly integrating with other property management systems.
4. Advanced reporting and business intelligence: CFOs are under pressure to provide accurate financial insights to stakeholders. A platform with robust reporting and business intelligence tools can generate detailed, real-time financial reports—whether for internal review or to update investors. This visibility supports better decision-making and investor confidence.
5. Seamless integration: CFOs are already using a variety of systems for project management, CRM, or property management. Financial management software must integrate with these tools to ensure that data flows seamlessly between platforms. This provides CFOs with a comprehensive view of financial performance across all business areas.
Speed of implementation and value in ERP systems
One of the greatest challenges CFOs face when adopting new financial management software is the time required for implementation. Traditional ERP systems, especially for mid-sized businesses, can take months or even years to fully deploy, causing significant disruption to ongoing operations. As businesses scale, this lag can delay the realisation of the system's full value.
In fact, Gartner reports that 70% of ERP functionalities go unused and fail to meet expectations. This statistic highlights a major issue for businesses: investing in an ERP system with complex, unnecessary features that aren't needed. CFOs must focus on solutions that provide only the features relevant to their operations—avoiding the bloat that often comes with large ERP implementations.
The key to a successful financial management solution is a quick implementation, so businesses can see the benefits sooner. With cloud-based systems like AccountsIQ, deployment can be done in a fraction of the time compared to traditional ERPs. This rapid implementation not only reduces the risk of downtime but also helps CFOs take control of their financial management sooner, without having to wait months or years to unlock key features.
Additionally, focusing on essential functionalities ensures that businesses can streamline operations and accelerate growth, without being weighed down by unnecessary features that might not align with their current needs.
Strategic cost management and achieving growth in an uncertain market
The property sector is facing a unique set of challenges, but CFOs can leverage technology to not only manage costs more effectively but also position the business for growth. Automation of routine financial tasks frees up valuable resources, allowing CFOs and their teams to focus on more impactful activities like strategic planning, scenario forecasting, and financial analysis.
Using advanced business intelligence features, CFOs can model different scenarios, helping to foresee potential risks before they materialise. This foresight allows businesses to react proactively, whether that’s by adjusting pricing models, refinancing debt, or identifying new investment opportunities.
Additionally, a consolidated financial view across multiple entities enables CFOs to track performance in real-time, ensuring that they can adjust quickly and decisively to market shifts. In an uncertain economic climate, this flexibility is crucial to maintaining financial stability and achieving sustainable growth.
The smarter way forward for property sector CFOs
Property sector CFOs need tools that allow them to manage the present but also enable them to scale and grow the business in the future. With powerful reporting capabilities, seamless multi-entity management, and automation of routine financial processes, AccountsIQ enables CFOs to operate more efficiently, reduce operational costs and position their businesses for future growth.
Want to learn more about how technology is reshaping the role of today’s CFOs?
Download the full CFO Mindset Report to gain deeper insights into the evolving role of finance leaders and discover how technology is helping property sector CFOs stay ahead in a rapidly changing market.

Find out how financial accounting software with automation can streamline your month-end accounting, cut closing time, reduce errors, and get real-time financial insights.
Month-end: these two simple words are enough to make even the most resilient finance professional sigh and reach for another cup of coffee.
Manual reconciliations, juggling spreadsheets, late nights and a social life on hiatus—it’s a high-stakes balancing act where even a miniscule error can bubble into a costly mess.
But what if closing the books didn’t have to be such a headache?
Read on to find out five key reasons why automation is the game-changer you and your finance team needs, complete with some practical examples of what that looks like in action.
1. Boost efficiency and save time
The month-end close is a labour-intensive process involving manual data entry, reconciliations, and chasing down missing figures. It’s slow, tedious, and riddled with opportunities for human error.
Automating the month-end close process speeds things up significantly. Tasks that once took days (or weeks) can now be done and dusted in hours, giving your finance team the freedom to focus on more valuable activities—like staying on top of current trends, advising leadership, or upskilling.
The result? A smoother, faster close with a team that’s happier and less prone to burnout.
Real-world scenario:
A mid-sized company where the finance team typically spends 10+ days on month-end.
After implementing financial accounting software, they cut that down to three. That’s an entire workweek reclaimed each month—what would you use that extra resource for?
2. Increased accuracy, minimised risk
Numbers don’t lie—but human error is a fact of life. From a rogue digit in data entry to that journal entry that slipped your mind, the tiniest of errors can throw off financial statements. And that could lead to compliance issues and decisions made with incorrect data.
Using accounting automation means these risks are dramatically reduced. Automated reconciliation tools, AI-backed error detection, and real-time data validation work together like a dream-team to make sure that the numbers add up.
That’s right. No more cross-checking endless spreadsheets or scrambling to find discrepancies (unless you really, really want to).
Real-world scenario:
A finance director at a fast-growing SaaS company notices frequent errors in their manual close process.
After switching to automated financial accounting software, discrepancies drop by 90%, which means more reliable reporting, fewer last-minute corrections, and better decision-making.
3. Smarter decisions, backed by data
In today’s fast-moving landscape, outdated financial data is about as useful as a teapot made of ice. Stakeholders need real-time insights, not reports that are already stale by the time they land in their inbox.
By automating month-end close, finance teams get instant access to up-to-date, accurate financial data. That means better cash flow management, better-informed budgeting, and the ability to respond quickly to opportunities or risks.
The bottom line is this: when your numbers are always on point, you can make smarter decisions and guide your business into the future with confidence.
Real-world scenario:
A retail chain uses automated financial reporting identified a dip in profitability early in Q4.
With real-time insights, they adjust pricing strategies and inventory management in time to recover before year-end—something they wouldn’t have caught with a slow, manual process.
4. Better collaboration and team efficiency
Tired of playing email tag when trying to track down missing numbers? Sick of struggling with version control on a shared spreadsheet? You’re not alone.
Manual month-end processes often create bottlenecks and barriers to communication, slowing everything and everyone down in their wake.
Automation prunes these inefficiencies out of your workflows by providing a centralised, cloud-based platform where teams can access, update, and reconcile data in real time.
When everyone is on the same page, the back-and-forth disappears and you can win back your most valuable resource: time.
Real-world scenario:
A global business with multiple finance teams across several time zones switches to an automated accounting system.
The result? Seamless collaboration, no duplicated efforts and a month-end process that flowed smoothly, regardless of location.
5. Faster financial reporting
In today’s financial landscape, speed is everything. If it takes too long to generate reports, decision-makers are flying blind.
Automated month-end close speeds up financial reporting, ensuring that key stakeholders always have timely insights into business performance.
Faster reporting means quicker responses to market changes, better financial planning, and a competitive edge. Instead of waiting for the numbers to come in, leaders can act on them immediately.
Real-world scenario:
A fast-scaling tech startup reduced its financial reporting turnaround from two weeks to two days by automating its close process. That agility allows them to adjust growth strategies in real time, rather than relying on already-outdated figures.
Ready to automate?
If your month-end close is still a stressful, manual process, it’s time to embrace the future. With accounting automation, you can close faster, reduce errors, and free up your finance team to focus on what truly matters—driving business growth.
Better begins now. Discover how AccountsIQ can level up your finance function with a free demo and take the first step towards a smarter, stress-free month-end close.

At AccountsIQ, we are excited to announce our partnership with Joblogic, the UK’s leading service management software provider. This integration is designed to help service-based businesses overcome the common challenges of disconnected financial and operational workflows, enhancing efficiency, accuracy, and scalability.
At AccountsIQ, we are excited to announce our partnership with Joblogic, the UK’s leading service management software provider. This integration is designed to help service-based businesses overcome the common challenges of disconnected financial and operational workflows, enhancing efficiency, accuracy, and scalability.
Addressing industry challenges
Many businesses in the service sector struggle with fragmented systems that require manual data reconciliation. This often leads to inefficiencies, increased costs, and a heavier administrative burden. Joblogic users, who typically rely on entry-level financial management software with significant manual workarounds, can now benefit from a more seamless approach to managing both job and financial data.
By integrating AccountsIQ with Joblogic, businesses can eliminate inefficiencies through automated data synchronisation. This integration connects key financial information, including invoices, payments, tax codes, and inventory locations. As a result, businesses save time, improve financial reporting accuracy, and empower their teams to focus on higher-value tasks.
A cost-effective, scalable solution for ambitious businesses
Our CEO, Darren Cran, highlights the significance of this collaboration: “Partnering with Joblogic represents a major step in transforming how service-based businesses manage their financial and operational workflows. For Joblogic customers currently relying on entry-level software, this integration offers a seamless upgrade to a robust, cloud-based solution at a fraction of the cost of comparable packages. On average, AccountsIQ costs just one-sixth of the total cost of ownership compared to other suppliers, a critical advantage in today’s competitive market.”
James Whatmore, CEO at Joblogic, shares his thoughts on this strategic partnership: “At Joblogic, we’ve long recognised the importance of integrating financial systems with operational workflows to drive real business value. While we already offer integrations with several accounting platforms, our partnership with AccountsIQ brings something new to the table: advanced functionality tailored for ambitious, fast-scaling service businesses. This integration is a strategic step forward, giving our customers access to a more powerful financial platform that complements the depth of Joblogic’s operational tools. It’s about enabling smarter decisions, reducing friction and supporting sustainable growth as our customers scale.”
Driving smarter financial management
At AccountsIQ, we are committed to providing finance leaders with the tools they need to drive smarter decision-making and streamline financial processes. Our cloud-based platform ensures businesses can scale efficiently while benefiting from advanced automation and real-time insights.
This partnership with Joblogic underscores our mission to make financial management effortless, empowering businesses to focus on what truly matters - delivering outstanding service and driving growth.

When it comes to accounting software, pricing needs to be straightforward, not a guessing game or a mysterious unknown. But businesses are increasingly being blindsided by unexpected price hikes, extra charges for features that were once included, or rising subscription costs without warning or proper communication from their software providers.
When it comes to accounting software, pricing needs to be straightforward, not a guessing game or a mysterious unknown. But businesses are increasingly being blindsided by unexpected price hikes, extra charges for features that were once included, or rising subscription costs without warning or proper communication from their software providers.
Some big software companies count on inertia—raising prices quietly, hoping customers won’t notice or won’t want the hassle of switching to a more transparent, cost-effective alternative.
But here’s the thing: you don’t have to play ball when they change up the rules of the game. Knowing what to look for and what questions to ask will help you safeguard your business from hidden fees and unpredictable pricing traps—so let’s jump in.
The hidden costs lurking in accounting software
Here’s the scenario. You sign up for accounting software at a reasonable price. A few months down the line, you realise that essential features—multi-entity consolidation, advanced reporting, or even that shiny AI-powered tool that came as part of the package—are now locked behind additional paywalls.
You also discover that the 24-hour support you were promised is only available via a third party at extra cost. Here’s where hidden costs typically sneak in:
Without clarity on these costs from the outset, you can end up shelling out significantly more than you bargained for.
The impact of ‘surprise’ price increases
An unexpected price increase isn’t just annoying; it can throw off your financial planning and disrupt operations. Imagine budgeting a fixed amount for accounting software, only to find that prices rise mid-contract, or key features move to higher-priced tiers.
This isn’t just a frustrating inconvenience—it directly impacts cash flow, forecasting and operational efficiency.
Some providers, despite their size and history, seem to treat price hikes as an unavoidable, routine ‘occupational hazard’—forcing their customers to absorb the additional cost or scramble to find an alternative.
But the plot thickens: when such increases are accompanied by endless rounds of 'strategic restructuring' to boot, customers can be left scratching their heads, wondering if their rising fees are covering innovation, the cost of internal shake-ups—or perhaps just plain greed.
Let’s say you’re running a small to medium-sized business, you might start with an affordable plan. But as you scale, you realise that integrating new entities or automating reports comes with a hefty cost increase.
Suddenly, the software that once seemed budget-friendly has become a financial burden with a significant impact on your resources.
How to protect your business from hidden fees
Transparency is key when selecting accounting software. Here’s how to avoid getting caught off guard:
1. Do your homework
Before committing, scrutinise the pricing structure of any accounting software provider. Ask for a detailed breakdown of costs, including potential add-ons.
If pricing details aren’t readily available and clear as day on their website, that’s probably a red flag.
2. Read all the fine print
Contracts and service agreements often contain clauses about price increases. Look for details on (and ask questions about):
3. Don’t be afraid to negotiate
When engaging with vendors, ask for:
4. Compare pricing models
Different software providers use different pricing models:
5. Choose a vendor committed to transparency
Not all accounting software providers build their success on hidden costs. Not to brag, but AccountsIQ, for example, offers a clear and predictable pricing model, ensuring businesses know exactly what they’re paying for upfront—no surprises, no creeping costs.
AI-powered automation: Cost-saving tool or hidden expense?
AI-powered automation is transforming finance functions, making manual processes like reconciliation, forecasting, and reporting faster and more efficient.
But while AI is there to streamline workflows, some providers see it as an opportunity to introduce new charges—be sure to ask:
Are any AI features included in the base price?
Will any AI capabilities be subject to future premium pricing tiers?
Is automation charged per use, or capped at certain usage limits?
What to do when your provider increases prices
If you’re facing repeated price hikes or suddenly find yourself being charged for features that used to be free (e.g. Sage Copilot), it’s time to take a stand. Here’s what you can do:
1. Assess the long-term cost implications
A small percentage increase might not seem like a big deal—at first. But frequent hikes add up and creep up on you over time. And that’s what some providers are counting on.
Take this real-world scenario as an example: Sage 50 imposed a 10% price increase in September 2024, with another 8% rise due in April 2025.
Sage Intacct followed a similar pattern, with a 9% price increase last year and another 8% this year. If this trend continues, what would your costs look like in three years? It’s worth crunching the numbers and making the move to an alternative ahead of time if you need to.
2. Check if you can opt out of new charges
Let’s continue with Sage as a real-world example. The company has recently introduced a £20 monthly charge for Sage Copilot, its AI assistant, which was previously free.
Additional per-document fees for AI-driven automation are also being rolled out, particularly for processing purchase invoices, hinting at a shift towards actively monetising AI features on the platform.
So, If your accounting software provider starts charging for tools you originally had access to for free, check your contract terms to see if you can opt out or if you’re locked in.
3. Speak to your provider
If you’re unhappy with a price increase or new charges, speak to your provider’s customer support or your sales point of contact if you have one. Ask if they offer:
4. Shop around and compare alternatives
Price hikes are often based on the assumption that switching is too difficult. But there are accounting software solutions out there that make migration easier than ever.
Unlike legacy systems that require complex transitions, providers like AccountsIQ offer seamless onboarding, full data migration support, and dedicated customer assistance to help businesses move away from providers that keep increasing costs.
5. Make the move to transparent pricing
If your current provider has a history of price hikes, consider switching before the next increase hits.
With AccountsIQ, you’ll always get a transparent, predictable pricing model—no unexpected fees, no forced add-ons. Just a product you can trust, clear communication on pricing, and a team committed to doing the right thing by their customers.
4 questions to ask when choosing accounting software
If you’re at the stage of choosing a software package, there are a few measures you can take to protect yourself from surprise price increases. Here are 4 key questions you can ask:
1. What are the circumstances under which pricing may change?
2. Are AI-powered features included in the base price?
3. Is there a cap on pricing increases during the contract period?
4. Are future add-ons optional, or will they become mandatory over time?
The bottom line: Certainty is non-negotiable
Accounting software should empower businesses, not lock them into unpredictable pricing models.
By prioritising transparency, reading the fine print, and choosing providers that commit to upfront, predictable pricing, you can make sure your software remains a valuable tool, not a hidden-cost sinkhole.

Slow approval processes have long been a barrier to finance team productivity across industries. With Darren Cran warning of their impact, we at AccountsIQ set out to eradicate the problem of approval delays with the launch of a smarter workflow solution designed to boost efficiency and give finance leaders more control.
Slow approval processes have long been a barrier to finance team productivity across industries. With Darren Cran warning of their impact, we at AccountsIQ set out to eradicate the problem of approval delays with the launch of a smarter workflow solution designed to boost efficiency and give finance leaders more control.
The problem: approval delays are slowing business growth
As finance leaders and their teams increasingly rely on powerful finance tech to make data-backed decisions, the need for faster, more efficient approval processes has never been more critical. However, many businesses are still struggling with outdated, manual workflows that lead to unnecessary delays and missed opportunities.
As Darren Cran puts it: “Slow approvals cost more than time; they cost growth.” Any delay can have a significant impact on a company’s ability to scale and remain competitive.
The solution: AccountsIQ’s new workflow approval engine
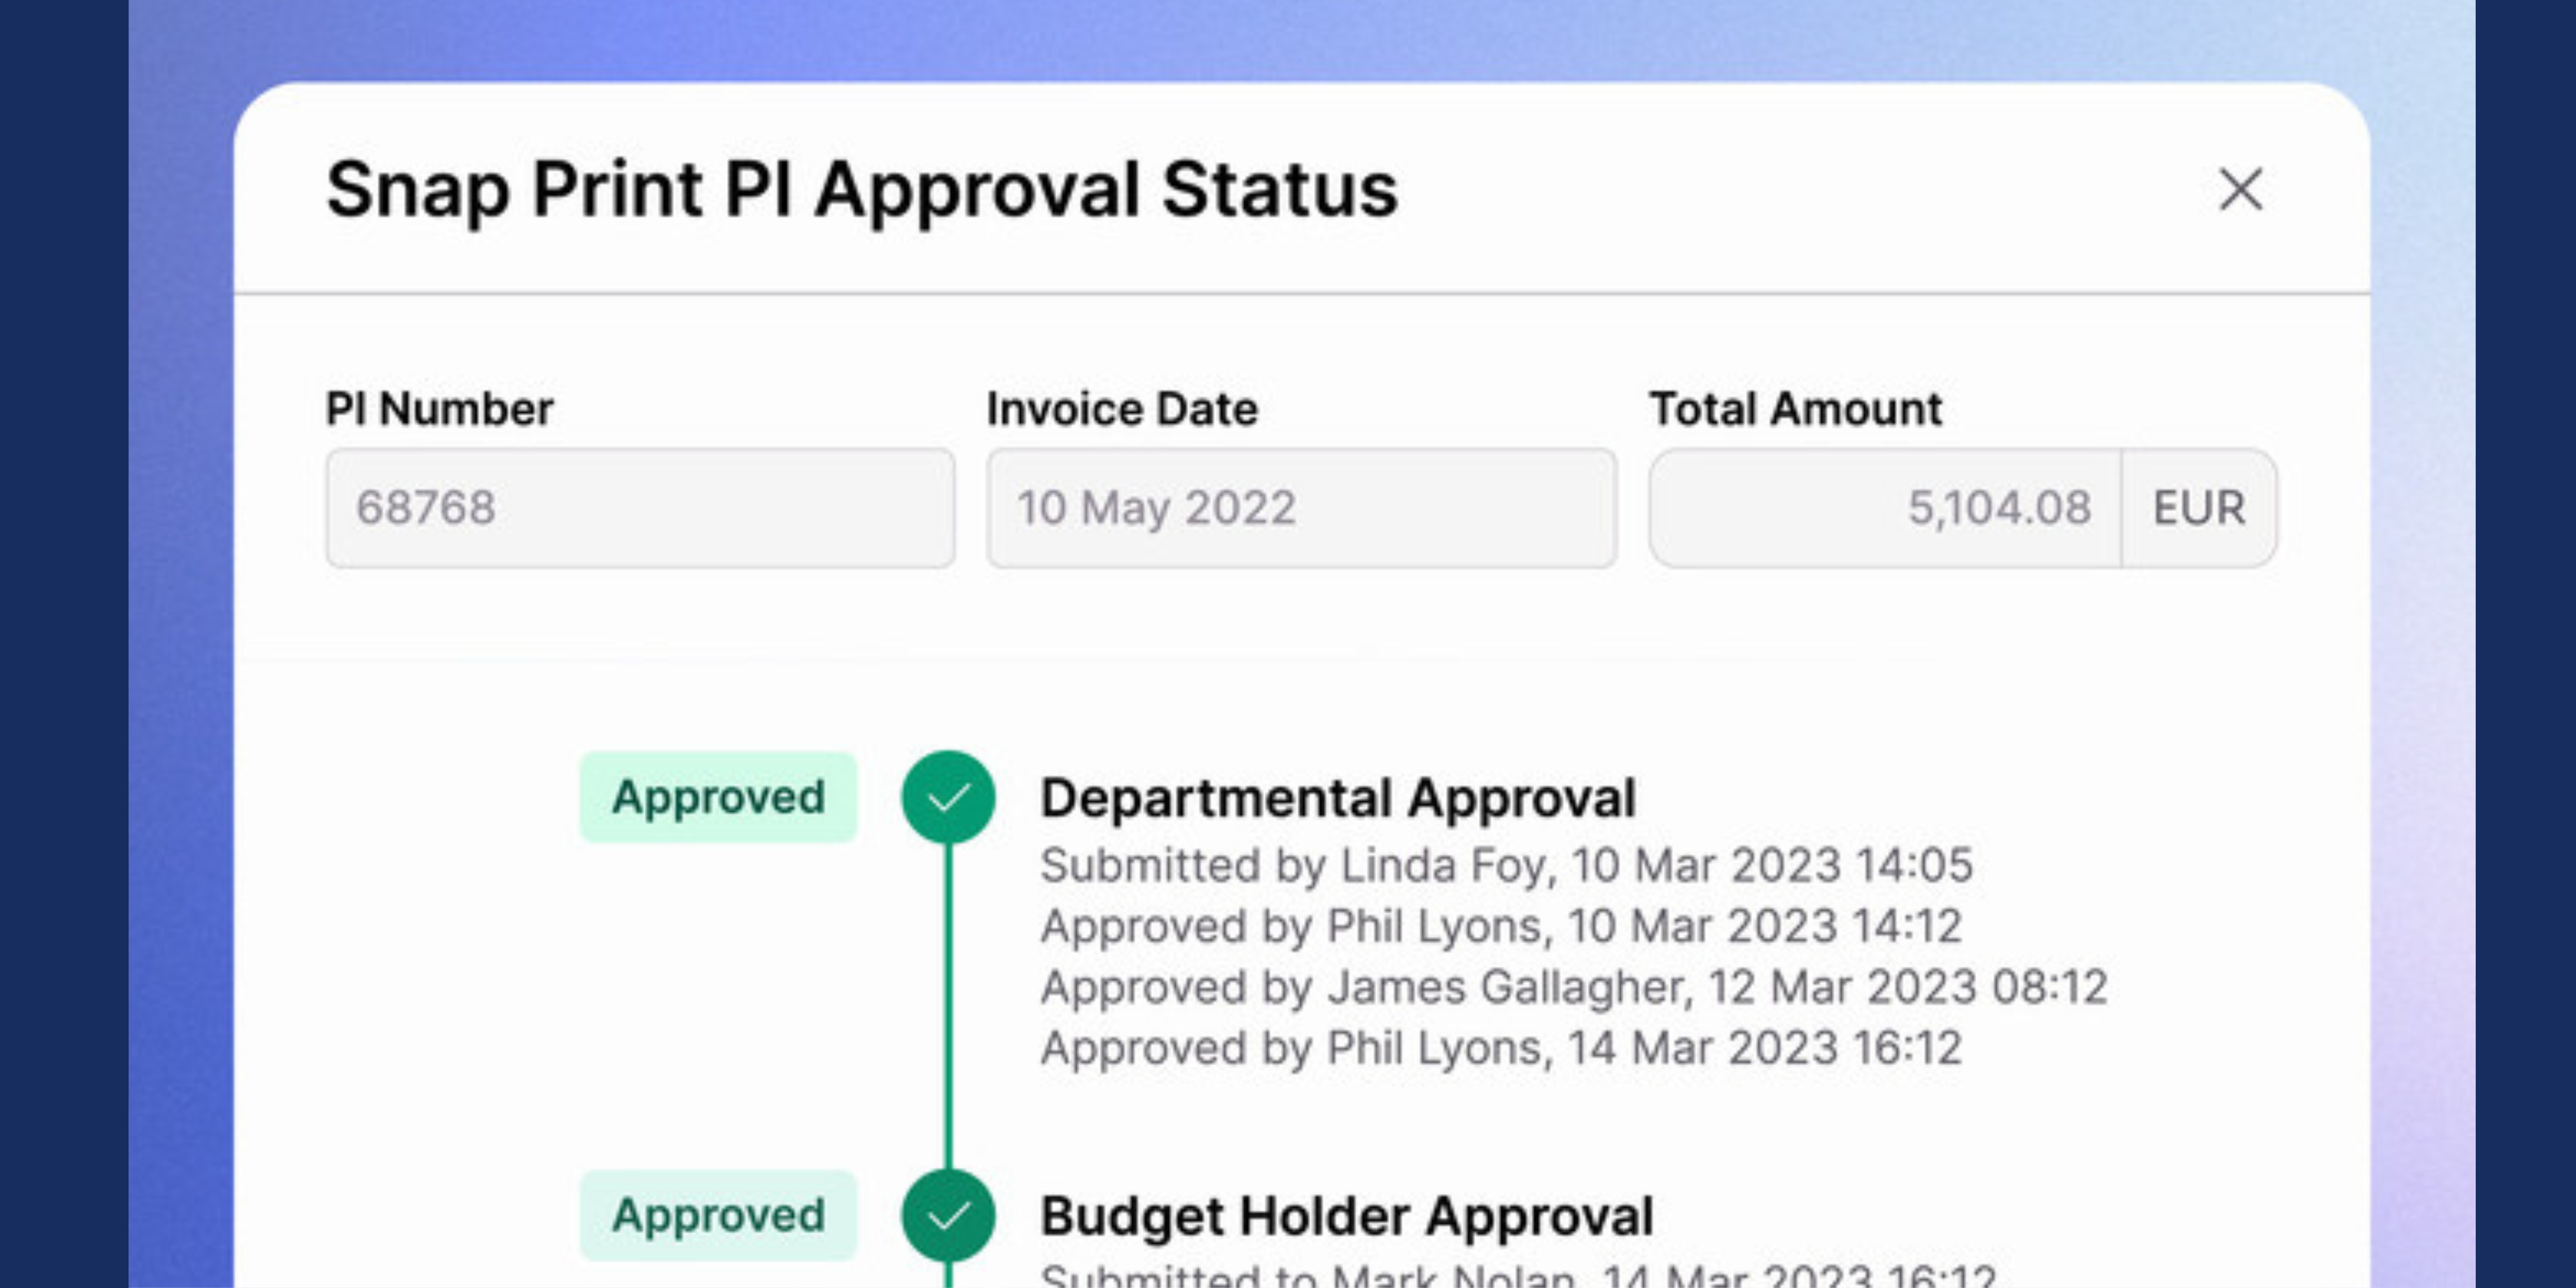
At AccountsIQ, we understand these challenges – and we’re here to help. We’re excited to introduce our new workflow approval engine, a powerful tool designed to transform how finance teams manage approvals. The engine streamlines financial workflows, improves compliance and enhances visibility, all while reducing reliance on manual processes.
By automating approval processes, the workflow approval engine enables faster decision-making, fewer errors, and smoother progress on tasks. It’s a game-changer for finance teams looking to get more done while ensuring everything stays on track and is accurately recorded.
Customisable, flexible and tailored for your business
One of the standout features of the workflow approval engine is its flexibility. The engine allows businesses to create customisable, multi-step approval workflows that align with their unique needs. Whether you’re managing a single entity or a complex multi-entity structure, the engine adapts to your requirements, making it easier to transition from legacy systems with minimal disruption.
This level of control ensures finance leaders have the visibility they need to guarantee each step of the approval process follows internal policies and remains compliant with regulations.
Empowering CFOs and finance teams for the future
As CFOs and finance leaders take on more strategic roles within their organisations, the tools they use need to help them perform more efficiently – not get in their way. Darren Cran emphasises this: “Our mission is to make their work easier and more efficient, ensuring they can add more value to the business with finance as a central function. The workflow approval engine does exactly this.”
Beyond just improving efficiency, the engine enhances compliance by offering real-time insights into approval progress. This means that finance leaders can rest assured knowing all approvals are transparent, well-documented, and compliant with audit requirements.
Ready to streamline your approvals?
At AccountsIQ, we’re all about supporting growth. With the new workflow approval engine, we’re making it easier for businesses to streamline their approval processes, reduce delays and stay compliant – all while gaining better control and visibility.
Want to see how it works? Watch our recent webinar, 'The key to smarter workflow approvals', where our experts will show you how to streamline approvals, improve compliance and fully leverage the flexibility of our workflow automation tools.
Automated workflows are transforming finance approval processes by eliminating delays, enhancing visibility and improving compliance. Manual processes often cause errors and inefficiencies. By adopting automation, finance teams can speed up decision-making, reduce manual tasks, and ensure better control.
Businesses are under increasing pressure to make swift, informed financial decisions. Yet, for many organisations, outdated manual approval processes continue to linger. With little time to adapt to clunky finance systems, finance professionals often revert to old ways of working. Slow approvals are an all-too-familiar frustration for finance teams. Beyond being tedious, they can restrict growth, limit cash flow visibility and create unnecessary friction across teams - particularly during periods of growth and expansion.
By adopting automated approval workflows, finance teams can tackle these challenges head-on. With better cloud-based technology that streamlines approval processes, businesses can gain greater visibility, improve compliance and ultimately enhance decision-making. But where should you start? The first step is pinpointing why traditional methods are holding you back.
Manual approval systems often rely heavily on email chains, spreadsheets and disconnected systems. This fragmented approach creates several key issues:
•Stagnant delays: Approvals can stall when key approvers are unavailable, causing disruption to cash flow and supplier relationships.
•Lack of visibility: Finance teams often struggle to track the status of approval requests, leading to inefficiencies and missed deadlines.
•Compliance risks: Without clear audit trails and controls, businesses risk non-compliance and potential financial exposure.
•Error-prone processes: Manual data entry and disparate workflows increase the likelihood of issues such as payment errors or duplicated invoices.
Automated workflows address these challenges by significantly streamlining the approval process:
•Faster decision-making: Automation eliminates the need for manual chasing and ensures approvers receive timely notifications. This speeds up the overall process and prevents important approvals from stalling.
•Improved visibility: Real-time dashboards and reporting provide finance leaders with clear oversight of pending, approved and rejected requests. This ensures greater accountability and more informed decision-making.
•Stronger compliance controls: Automated workflows can be configured to enforce internal policies, ensuring every step follows the correct procedures. This audit-ready structure makes compliance easier to maintain.
•Reduction in manual tasks: By automating repetitive steps such as routing approvals or updating financial records, finance teams can spend more time on value-driven activities.
Enhancing the user experience for finance teams
The difference a modern automated workflow engine makes can’t be overstated. Intuitive interfaces allow finance teams to build and manage workflows easily, even with minimal technical knowledge, ensuring processes can evolve with business needs.
Key features that enhance user experience include:
•Customisable rules and triggers: Finance teams can define multi-step approval processes tailored to their organisation's structure and policies.
•Mobile approvals: Approvers can approve or reject requests directly from their devices, ensuring tasks progress smoothly even when team members are away from their desks.
•Budget visibility for approvers: By showing approvers the current budget status before approving a spend request, they can make better-informed decisions.
Future-proofing finance teams with automation
As the role of finance leaders continues to shift with new tech and growing demands across other areas of the business, automated processes are essential for maintaining growth, improving efficiency and staying in control of the finance function.
By adopting automated approval workflows, finance teams can leave behind gruelling processes, improve visibility between team members, and spend less time chasing manual processes. For businesses ready to enhance their finance operations, implementing automated workflows is a powerful step toward a more efficient and scalable future.
Unlocking new efficiencies with AccountsIQ's Workflow Approval Engine
For organisations aiming to modernise their finance operations, AccountsIQ delivers innovative, powerful, and product-driven solutions to streamline approvals. The new Workflow Approval Engine empowers finance teams with improved visibility, stronger compliance controls, and greater flexibility when designing approval processes.
Stay tuned for an exciting update on AccountsIQ’s latest release this week!

Our latest blog explores the 5 challenges CFOs face in 2025, and how online financial accounting software can help navigate uncertainty, investments, and digital transformation.
The role of the CFO has never been more important—or more adaptable. As economic landscapes evolve faster than ever before, finance leaders are tasked with navigating complex challenges that demand strategic thinking, technological insight, and increased flexibility.
It comes as no surprise, then, that at least 63% of CFOs claim they feel overwhelmed by the financial challenges facing their organisation multiple times a month, while a quarter (25%) saying they feel this way several times a week.
In this article, we’ll check out the top 5 economic challenges CFOs and finance leaders face in 2025, with some insights into how you might navigate them effectively.
1. Economic uncertainty
Economic uncertainty has been around, weaving through the decades, for as long as humans have used currency. But post-pandemic it has become the norm, and financial planning has morphed from a predictive exercise to a delicate risk-management form of accountancy art.
CFOs are now expected to have robust scenario planning capabilities that go beyond traditional forecasting. Leveraging advanced financial accounting software has become crucial in this endeavour, allowing for real-time data analysis and quick, strategic pivots.
To thrive rather than survive, finance leaders today need to look at this uncertainty not as a threat, but as an opportunity for innovation. But how can they aim for better and achieve more while navigating frequent changes and sometimes unexpected roadblocks?
With the help of comprehensive accounting and financial management software, ambitious finance teams can create multiple financial scenarios, stress-test the possible outcomes, and respond with agile strategies that safeguard short-term stability and boost business performance, without compromising long-term growth.
2. Balancing strategic and business investment
Striking the right balance between strategic and operational investments has never been more challenging. CFOs and other finance leaders now have to act as business advisors, carefully digging into investment opportunities through a lens of immediate implications as well as considering future potential.
This calls for an approach that moves beyond traditional financial management and into something more holistic. To that end, accounting and financial management software can be an invaluable tool in this process, providing cutting-edge analytics that support CFOs in making better, more informed and data-driven decisions.
The aim here is to craft an investment strategy that balances risk mitigation against growth potential, making sure that every financial commitment pays into the company’s broader strategy and objectives.
3. Interest rate fluctuations and cost increases
Our inaugural CFO Mindset Report found that when it comes to challenges facing their finance function, 40% of CFOs said that “inflation and rising costs impacting profitability” were the main issues keeping them up at night.
Volatile interest rates continue to raise significant challenges for financial planning. CFOs need to develop sophisticated hedging strategies and maintain exceptional financial flexibility to mitigate potential risks. This means not just reactive measures, but proactive financial engineering that anticipates and neutralises potential economic disruptions, leading to smarter decisions and prolonged success.
Accounting software for financial advisors has evolved to provide sophisticated modelling capabilities, allowing finance leaders to simulate various interest rate scenarios and their potential impacts.
Having these advanced tools in their back pockets empowers CFO to develop comprehensive strategies that protect organisational financial health without giving up competitive momentum and agility.
4. Digital transformation and advanced analytics
A staggering 86% of finance leaders feel decisions about financial strategy are made without sufficient data or insight. It comes as no surprise, then, that digital transformation is no longer an optional strategy but a non-negotiable for leadership.
With advanced analytics and artificial intelligence revolutionising decision-making processes, finance leaders are well placed to provide next-level insights and inform strategic decisions across their organisations. CFOs who successfully integrate these types of cutting-edge solutions can transform their finance departments from traditional accounting centres to strategic innovation hubs.
It’s worth remembering that this involves not just rolling out new technologies, but nurturing a culture of continuous learning and technological adaptation to back it up. If your team is trained up and confident in the technology they’re using, the entire organisation will reap the rewards.
5. The talent gap and leadership expectations
The evolving technological landscape has created a significant talent gap in finance leadership. Modern CFOs are expected to be half-financial expert, half-technological strategist and all-around organisational innovator.
This calls for a multi-faceted approach to talent development and recruitment. To achieve this, organisations need to do three things: invest in continuous learning programs, create cross-functional training opportunities, and develop comprehensive talent strategies that attract and retain multiskilled finance professionals who can navigate the complex economic landscape of 2025.
As we navigate the intricate economic challenges of 2025, the most impactful CFOs will be those who don’t view uncertainty as a threat, but as an opportunity. They’ll leverage advanced technologies, and maintain strategic flexibility to weather any financial storm. They understand that with the right foresight their company finance function can be better simply by implementing software and tools that can not only boost performance but also reduce stress and increase productivity in teams, allowing them to both work and live better.
Finally, the future of financial leadership lies not in predicting the perfect, most precise path forward, but in building organisational resilience and adaptability. By integrating sophisticated financial technologies, leaning on comprehensive scenario planning capabilities, and building a culture of continuous innovation, savvy CFOs can turn economic challenges into opportunities for fantastic organisational growth.
Find out more about the challenges CFOs are facing and how to navigate them in our CFO Mindset report.
Book a demo today to see the AccountsIQ platform in action.
Kelly Dent is a writer and editor with over 10 years’ experience across a range of industries, from accounting and AI to cloud technology, entrepreneurship, and beyond.

In this blog, we explore how multi-entity consolidation software can empower CFOs to streamline financial processes, track key metrics, and drive sustainable growth in 2025 and beyond.
As your business evolves and grows into new regions and industries, so does the complexity of managing multiple entities. For CFOs and finance leaders, the year ahead promises a heightened focus on seamless multi-entity consolidation—a crucial process for maintaining clarity in a rapidly evolving financial landscape.
In this blog, we’ll take a closer look at what multi-entity consolidation looks like in 2025, why streamlined consolidation matters, and how the right metrics can empower you and your team.
Jump to section:
- Financial performance metrics
- Financial reporting and close metrics
- Predictive analytics and AI
- Entity-specific metrics
- Optimising your tech stack
To get the best view of a company’s financial performance, reporting efficiency, and operational health, CFOs need the right metrics on hand. From revenue streams to predictive analytics, these metrics provide actionable insights that drive strategic decisions—let’s dive in.
From revenue streams to cash flow and intercompany transactions, these metrics are the foundation for smart decision-making and sustained growth.
How long does it take your finance team to close the books? Tracking the efficiency of your financial close process can reveal bottlenecks and highlight opportunities to streamline workflows.
When working in fast-paced markets, having real-time data to back you up is invaluable. Use real-time financial reporting for more accurate decision-making and to keep stakeholders informed without delays.
Finally, adhering to IFRS, GAAP, and other global standards is non-negotiable. Having the right multi-entity consolidation software on your side allows for consistent reporting across jurisdictions, cutting the risk of compliance breaches.
A staggering 86% of CFOs feel decisions about financial strategy are made without sufficient data or insight. Luckily, AI-powered predictive analytics tools are here to help.
AI tools and predictive analytics (backed by AI) provide advanced forecasting capabilities, making it easier to translate the information you have into future-focused action. These tools use historical and real-time data to make more accurate predictions about financial trends, helping you and your team to be more proactive.
Here, use dashboards to consolidate key financial metrics into an easy-to-digest format, while data visualisation tools allow CFOs and finance teams to identify trends, anomalies, and actionable insights more quickly.
By using predictive models, organisations can better anticipate challenges and opportunities. From forecasting cash flow to projecting revenue, these insights allow finance teams to stay ahead of the game.
Staying ahead also means keeping a close eye on individual entity performance. Track each entity’s performance individually to get a detailed snapshot of your organisation’s overall performance. This also highlights how individual units contribute to the bigger picture.
Here, multi-currency operations can be a challenge, but tracking exchange rates and their impacts on financial performance is critical.
The right software simplifies multi-currency management, ensuring accurate and consistent reporting. Assessing the financial health of individual business units enables CFOs to make data-driven decisions about resource allocation, strategic investments, and divestments.
Choosing the right consolidation software
Not all multi-entity consolidation software is created equal. Many packages are high cost, have long and complex implementation periods and often comprise far more functionality than companies actually need or use. When evaluating options, prioritise solutions that offer scalability, seamless integration, and robust reporting capabilities.
Your consolidation software should integrate smoothly with your existing tech stack, including ERP systems, payroll software, and other financial tools. Taking the time to find the right solution will pay off, reducing manual work and increasing efficiency across your finance function.
Automation reduces the time and effort required for tasks like intercompany reconciliations and financial reporting. This not only improves efficiency but also minimises errors—sounds good, right?
By centralising financial data and automating consolidation workflows, you can achieve faster close cycles and more accurate reporting. And with 85% of CFOs and finance leaders reporting that they need 1-2 extra days per week to clear their backlog, automation could be the key to a more streamlined process that frees up time for decision-making, strategy, and a better work-life balance to boot.
Tracking key metrics in multi-entity consolidation goes beyond ticking compliance boxes—it’s a strategic game-changer. With modern multi-entity accounting software, CFOs are empowered with real-time data and actionable insights that drive smarter financial planning and execution.
As we step into a new year, one thing is clear: in 2025 and beyond, leveraging technology and data will define the modern CFO’s path to financial excellence.
Ready to optimise your consolidation process? Book a demo to see how the right multi-entity consolidation software can accelerate your strategy in 2025.
Kelly Dent is a writer and editor with over 10 years’ experience across a range of industries, from accounting and AI to cloud technology, entrepreneurship, and beyond.

Scaling a tech businesses is an exciting yet demanding phase. While early stages often involve building everything from scratch, including financial processes, scaling demands a shift in mindset. Founders and finance leaders no longer need to rely on ad-hoc systems at every step. Instead, they can leverage advanced tools to build on their existing foundation, enabling smarter, faster and more confident decision-making.
Scaling a tech businesses is an exciting yet demanding phase. While early stages often involve building everything from scratch, including financial processes, scaling demands a shift in mindset. Founders and finance leaders no longer need to rely on ad-hoc systems at every step. Instead, they can leverage advanced tools to build on their existing foundation, enabling smarter, faster and more confident decision-making.
The transition is essential because scaling brings increased complexity. Multi-entity operations, intricate reporting requirements and a growing finance department demand robust systems that can handle challenges, both internal and external. As highlighted in our latest CFO Mindset Report, 86% of CFOs admit to making a majority of key decisions without adequate data. The solution isn’t just better processes – it’s adopting smarter systems and tools as early as possible, that provide the insights and efficiency needed to scale confidently and sustainably.
Moving beyond ‘risk mode’
Ambitious businesses often operate with a mindset built around taking risks, in order to grow the business fast and make an impact. While this works at first, this ad-hoc and unstructured approach can start to hold the company back.
Key challenges include:
To move beyond these challenges, scaling businesses need systems that evolve with them, offering the tools to build on their existing foundation without starting over.
Why ambitious tech businesses need smarter financial tools
A modern financial management system (FMS) eliminates the need for reinvention. It enables startups to build on their early-stage momentum while addressing the unique challenges of scaling. Here’s how AccountsIQ supports this:
Skip the reinvention cycle with scalable solutions
AccountsIQ offers a scalable platform that grows with the business, eliminating the need to ‘start over’ as complexity increases. It allows businesses to seamlessly transition from basic tools to enterprise-grade functionality without disruption.
Speed and efficiency with automation
By automating consolidations, workflows and reporting, AccountsIQ removes the reliance on time-consuming manual processes. Finance teams gain back hours every week to focus on strategic decisions instead of operational headaches.
Real-time insights for confident growth
Advanced reporting tools provide real-time, comprehensive views of performance metrics, cash flow trends, and profitability. Leaders no longer need to piece together data - they get instant insights to guide decision-making.
Cost-effective, powerful growth
AccountsIQ bridges the gap between entry-level tools and costly enterprise systems, offering startups enterprise-level functionality at an accessible price point. This means businesses can scale effectively without heavy upfront investments.
A collaborative, adaptable system
Scaling is a team effort and AccountsIQ’s intuitive platform fosters collaboration across finance teams, founders and stakeholders. With support from the AIQ Academy, users can continuously adapt the system to meet evolving needs without downtime or complexity.
AIQ is designed to scale seamlessly with your business, offering essential features upfront and allowing advanced capabilities to be easily activated as your needs grow. There’s no need to adopt everything at once - implement additional tools and features when you’re ready, with minimal setup required
Build on what you’ve started - confidently
Scaling up no longer means starting over. With AccountsIQ, tech business can evolve their financial management systems, gaining the tools they need to tackle complexity while building on their existing foundation. The result? Smarter, faster and more sustainable growth.
Curious about the challenges CFOs face as they scale? Download the CFO Mindset Report for valuable insights into the key obstacles and strategies shaping finance leadership today.
Find out how AccountsIQ can help your tech business transition from early-stage tools to a robust, scalable platform in 29 days. Book a demo today to see how we can support your growth.

AccountsIQ, a leading provider of fully cloud-based accounting software, has today announced its acquisition of ExpenseIn, the expense management software that empowers businesses to take control of their expense and invoice management process.
AccountsIQ, a leading provider of fully cloud-based accounting software, has today announced its acquisition of ExpenseIn, the expense management software that empowers businesses to take control of their expense and invoice management process.
ExpenseIn, which joins the AccountsIQ Group and will continue trading with its existing name, shares AccountsIQ’s values and customer-centric approach. Founded in 2015, the company processes over a million expenses every month and has a customer base that spans over 40 countries. Its customers include Ascot, Corpay and Bath Rugby.
The acquisition reflects AccountsIQ’s vision to expand beyond finance teams into the broader business user function, bringing a multi-product solution to the office of the CFO, including spend card management and embedded payments.
Since Axiom’s investment in June 2024, AccountsIQ has made significant progress in enhancing its market-leading services. This includes the launch of cutting-edge product features and the strategic appointment of a world-class management team.
By integrating ExpenseIn’s advanced capabilities, the Group now supports a combined user base of over 175,000 users, providing a deeper, more integrated solution for modern finance teams. With plans to grow its team and further invest in product innovation, AccountsIQ is dedicated to delivering empowering technology that enriches the lives of its customers.
Darren Cran, CEO of AccountsIQ, commented: “Both AccountsIQ and ExpenseIn have a shared vision for innovation and growth, and we’ve had an increasing number of joint customers in recent years. This acquisition bolsters our position as a leading finance management solution for ambitious finance teams in the mid-market, with our combined knowledge and experience allowing us to really understand what our customers need and deliver the technology to match.”
Richard Jones, Managing Director of ExpenseIn, added: “There’s a natural synergy between our companies, as both AccountsIQ and ExpenseIn are passionate about delivering great products and experiences for our customers. We share a joint commitment to provide the office of the CFO with market-leading software and understand the changing requirements of fast-paced modern finance teams and the challenges they face. I look forward to working closely with Darren and the AccountsIQ team as we continue to innovate and scale.”
ExpenseIn will remain trading under its existing name with no disruption to customers or partners.

In our inaugural CFO survey, the CFO Mindset Report, we set out to uncover the challenges finance leaders face and explore the practical solutions they can use to overcome them. The findings show that today’s CFOs are under intense pressure, frequently working extended hours to meet the demands of their roles.
In our inaugural CFO survey, the CFO Mindset Report, we set out to uncover the challenges finance leaders face and explore the practical solutions they can use to overcome them. The findings show that today’s CFOs are under intense pressure, frequently working extended hours to meet the demands of their roles. Despite national calls for a four-day work week, 85% of CFOs and finance leaders reported needing six days to manage their workload. This relentless pace is causing higher stress levels, a sense of loss of control, and dilemmas over how to balance immediate tasks with long-term planning.
With over a quarter (25%) of finance leaders claiming they feel overwhelmed multiple times each week and 63% experiencing this several times a month, it’s clear finance teams are feeling the pressure. But the issue isn’t just the extra hours. It’s also the impact on CFOs’ ability to lead, strategise, and support growth. Many of the finance leaders we surveyed reported a loss of control, affecting both their well-being and their organisations' financial health.
The “CFO nightmares” keeping finance leaders up at night
Our CFO survey revealed several “CFO nightmares” that frequently keep them awake. CFOs most commonly cited:
Costs are rising, revenues are unpredictable, and security is an added concern. Issues with reporting accuracy add stress, as CFOs are often having to make data-driven decisions without reliable numbers or useful insights.
These combined challenges often lead CFOs to “work their way out of it” - 40% work extra hours to manage issues, 36% report heightened stress, 25% worry about reporting accuracy, and 24% feel mounting pressure from stakeholders.
Growing responsibilities, limited resources
Despite these pressures, 60% of CFOs report that their finance functions are scaling up. However, growth brings its own challenges, with an equal 60% saying their finance team is only somewhat capable of supporting expansion over the next three years.
A significant part of the problem is that many finance functions lack the CFO tools and insights to support growth. Over half (54%) of those surveyed feel their organisation doesn’t have the necessary information and analysis to make informed decisions, highlighting the impact of outdated systems and limited data integration.
The growing workload isn’t just about more transactions and larger budgets. CFOs are constantly called upon to provide financial analysis, advise on strategy, and monitor compliance - all while managing their teams and ensuring accurate reporting.
The potential of AI in transforming finance
CFOs are increasingly looking to automation and artificial intelligence (AI) to lighten their load and provide insights to navigate complexity. However, the potential role of AI in finance sparks mixed opinions. Our survey found that:
Despite differing views on AI's role, the rapidly advancing capabilities of this technology are increasingly becoming a central element of CFO challenges in 2024 and beyond. When effectively integrated, AI can significantly reduce the time CFOs spend on repetitive tasks, enabling them to focus on more strategic areas such as financial planning and risk management.
Reclaiming time with scalable technology
For finance leaders looking to reduce stress, reclaim time, and refocus on strategy, the right CFO software tools can make a profound difference. AccountsIQ’s cloud-based accounting software is designed specifically to help CFOs and finance teams stay in control, increase efficiency, and support sustainable growth.
With AccountsIQ, finance teams have access to:
AccountsIQ’s suite of tools helps finance leaders move from “firefighting” to forecasting, allowing them to take back control over their workdays and strategic focus.
For finance leaders who are ready to reduce stress and build a finance function that fuels long-term growth, scalable technology like AccountsIQ offers a transformative solution. Discover how in the full CFO Mindset Report - download it now!

A survey of CFOs and finance leaders across the UK and Ireland reveals they feel stressed, overworked and lacking control
An overwhelming majority (86%) of CFOs and finance leaders feel that decisions about their organisation’s financial strategy are made without sufficient data or insight, according to a new survey by AccountsIQ, an award-winning provider of cloud-native accounting software for mid-sized businesses.
The survey of 260 CFOs across the UK and Ireland highlights the increasing pressures facing finance leaders, with many reporting a growing sense of stress and instability as they navigate economic volatility, rising operational costs, and unpredictable revenue.
Economic challenges
The survey determined external factors currently facing CFOs and other senior finance professionals. The top threats to financial stability are economic downturns (46%), followed by limited technology and software (34%), and the accuracy of reporting (32%).
When it comes to internal challenges, the most significant issues cited are limited technology and software capabilities (34%), followed closely by concerns over the accuracy of financial reporting (32%). These factors are making it increasingly difficult for finance leaders to maintain control over their organisation’s financial future and therefore limiting the potential for long-term operational success.
Operating in survival mode
While 60% of CFOs say their finance function is scaling up to meet the demands of business growth, 16% describe it as actively slowing down. The call for modern solutions is clear, with 38% of CFOs stating that better financial technology and software would most help them regain control, and 36% pointing to the need for greater flexibility in budgeting.
Darren Cran, CEO of AccountsIQ, commented: “CFOs are facing immense pressure to make strategic decisions in the dark, without the right data or technology to support them. The sheer scale of the challenges they’re up against – from volatility to rising costs – is forcing them to operate in survival mode, rather than driving growth. This is where finance leaders urgently need better tools and insights - and the good news is, they are out there. These tools can build trust in the numbers and give CFOs the confidence to make informed decisions. It also empowers CFOs to shift from firefighting to forecasting, taking back control of their financial plans and driving sustainable business growth.”
Download the full report here for further figures and analysis.

Point of rental, AccountsIQ announce Syrinx integration. Partnership gives Syrinx users a cloud-based accounting solution
Partnership Gives Syrinx Users A Cloud-Based Accounting Solution
Point of Rental announced a new integration between Syrinx and AccountsIQ, providing hire businesses with a powerful, cloud-based financial management solution. Designed for companies outgrowing their entry-level systems, AccountsIQ offers advanced financial capabilities without the complexity or cost of a full ERP.
“This integration with AccountsIQ gives hire companies a modern accounting solution that supports their evolving needs,” said Wayne Harris, Point of Rental’s CEO. “We’re excited to keep adding new, innovative solutions for hire businesses.”
This seamless integration allows Syrinx users to transfer essential financial data—such as purchase orders and sales invoices—into AccountsIQ with ease, ensuring data integrity and efficiency.
Nick Longden, CRO of AccountsIQ, added: “The seamless integration between Syrinx and AccountsIQ takes away the inefficiencies and inaccuracies associated with manually re-keying financial data. It also ensures the integrity of the source data is retained and gives quicker access to financial insights to make informed business decisions.”
Pairing AccountsIQ with the newly-released Syrinx 365 Cloud delivers ultimate flexibility and control over a hire business’s financial operations by automating processes, eliminating manual tasks and simplifying multi-entity consolidation.
You can learn more about the integration at the upcoming Syrinx Conference, where AccountsIQ will host a dedicated session to showcase the benefits of cloud-based financial management to Syrinx users.
To learn more about the integration between Syrinx and AccountsIQ, contact Point of Rental’s U.K. sales team at uksales@pointofrental.com.

Effective consolidation is a critical component of a streamlined finance function, ensuring a smooth, error-free month-end process. It not only supports financial accuracy but also enhances visibility, strategic decision-making, and overall business performance.
As mid-market businesses scale and diversify across multiple units, the complexity of consolidating accounts for these entities increases significantly. This can be particularly challenging for finance teams during the month-end close, as they strive to deliver accurate and timely financial insights across numerous entities and subsidiaries.
Effective consolidation is a critical component of a streamlined finance function, ensuring a smooth, error-free month-end process. It not only supports financial accuracy but also enhances visibility, strategic decision-making, and overall business performance.
Solving the month-end multi-entity challenge with automated consolidation
Financial consolidation at month-end is a complex process involving the integration of data from various entities. These entities often deal with different currencies, follow diverse accounting policies and have intercompany transactions that must be reconciled and eliminated. Without a streamlined approach, this becomes a time-consuming, error-prone process that delays reporting and creates compliance risks.
Automation can simplify month-end consolidation by providing finance teams with a unified source of truth. This accelerates reporting, enhances transparency and supports better decision-making. With automation, businesses gain visibility across all entities, ensuring compliance with accounting standards and delivering real-time insights that help finance leaders analyse consolidated results and forecast accurately.
Key consolidation challenges for multi-entity accounts:
Complex ownership structures: Accurately reflecting minority interests and consolidating financials for multiple subsidiaries can be challenging.
Multi-currency management: Ensuring consistency with exchange rates and managing currency translations can be tedious without automation.
Intercompany transactions: Properly eliminating intercompany balances to avoid double-counting or misrepresentation.
Budget and performance analysis: Comparing budget information against actuals across entities is crucial for strategic decision-making. These challenges can limit business growth and disrupt strategies for effective scaling. A cloud-based platform such as AccountsIQ can provide a solution to these complex consolidation problems.
How AccountsIQ simplifies month-end consolidation
AccountsIQ is designed to streamline the consolidation of multi-entity financial data, providing a comprehensive solution that handles the unique challenges of month-end close. Here’s how AccountsIQ can help finance teams transform their month-end consolidation process:
Easy automation: AccountsIQ’s flexible, multi-layered consolidation module automates the aggregation of financial performance across subsidiaries, reducing manual effort. It seamlessly handles complexities such as minority interest calculations, foreign currency revaluation and equity adjustments, ensuring accurate and compliant consolidated accounts.
Multi-currency support: AccountsIQ streamlines consolidating subsidiaries with different reporting currencies. The system automatically converts the financials of foreign subsidiaries into the group’s reporting currency at predefined exchange rates. It also provides functionality to handle foreign currency revaluations and translation adjustments, which ensures that exchange rate differences are appropriately accounted for in the consolidated financial statements.
Intercompany elimination automation: AccountsIQ simplifies the elimination of intercompany balances and transactions, preventing errors and ensuring that consolidated financial statements reflect true business performance. This automation is critical for maintaining integrity in financial reporting.
Comprehensive consolidated reporting: with AccountsIQ, users gain access to a suite of reporting tools, including a report manager, OData connector, and consolidated dashboards. These tools provide insights across the group, offering visibility into consolidated sales, purchase analysis and overall financial health.
Budget management and variance analysis: AccountsIQ allows businesses to consolidate budget information from all entities, compare actual performance against budgets and assess variances at a group level. This capability supports better financial planning and strategic management.
Transforming month-end consolidation: why AccountsIQ stands out
Adopting AccountsIQ for month-end consolidation helps businesses overcome traditional barriers in multi-entity financial reporting. By automating the process, companies can shorten close cycles, increase accuracy and provide management with actionable insights faster. Here’s a quick comparison of manual vs. automated consolidation processes:
Manual consolidation Automated consolidation with AccountsIQ Prone to errors due to data entry and complex calculationsAutomated data aggregation and calculation eliminates errorsRequires significant time investmentRapid consolidation reduces month-end close timesLimited visibility across entitiesConsolidated dashboards and reports provide holistic insightsDifficult to handle intercompany eliminationsAutomated intercompany eliminations streamline the process
Streamline your month-end close with AccountsIQ
For multi-entity organisations, month-end financial consolidation is complex and time-consuming, especially when relying on manual processes. AccountsIQ’s multi-entity consolidation features automate these tasks, helping finance teams to manage complex ownership structures, multiple currencies and intercompany eliminations with ease.
By choosing AccountsIQ, businesses can streamline their month-end close, enhance compliance and gain a clearer financial view - freeing up time for strategic planning and decision-making. Want to learn more? Gain insights into how the AIQ platform can help through the consolidation overview video on AIQ Academy, our comprehensive learning hub.
Ready to transform your consolidation process? Book a demo today!

With our powerful cloud accounting platform, finance teams can automate manual processes, streamline operations and save days of work. This allows them to focus on higher-value activities such as strategic decision-making and financial analysis.
In our recent report exploring the frustrations and tech-led aspirations of finance professionals, we found that 94% of senior professionals and 96% of junior professionals feel frustration in their current roles. The common culprit? The chaotic month-end process. Consolidating multiple entities, juggling disconnected systems and relying on time-intensive manual reporting all add to the pressure.
But we have the solution. With our powerful cloud accounting platform, finance teams can automate manual processes, streamline operations and save days of work. This allows them to focus on higher-value activities such as strategic decision-making and financial analysis. Here’s how AccountsIQ simplifies and optimises your month-end close.
Consolidate your financial data across multiple entities with ease
One of the standout features of AccountsIQ is its multi-entity functionality. We make it easy to consolidate financial data across different entities, currencies and geographies, all within one platform. Instead of manually uploading data from various systems, AccountsIQ centralises your financial information, reducing the risk of errors and ensuring a smooth month-end close.
AccountsIQ’s automated bank feeds seamlessly integrate with your accounts, ensuring real-time transaction updates across all your entities. Whether you’re managing subsidiaries, international branches, or joint ventures, our software ensures that financial data is consolidated efficiently and accurately.
Automate reconciliation for multi-entity accounts and reduce errors
Manual reconciliation across different entities and currencies can be time-consuming and prone to errors. AccountsIQ simplifies this process by automating reconciliation for both single and multi-entity operations. Our platform automatically matches transactions, eliminating the need for tedious cross-checking and minimising discrepancies.
With our advanced solution, you can reduce the time spent on reconciliation while ensuring that your financial data remains accurate and up to date. This not only speeds up your month-end close but also provides greater confidence in the integrity of your financial reporting.
Generate real-time, accurate financial reports with a few clicks
Reporting is a critical part of the month-end closing process and AccountsIQ makes it faster and more accurate than ever. Our platform provides real-time financial reporting capabilities, allowing you to create and customise reports with just a few clicks. From consolidated P&L statements to balance sheets, you can generate accurate, up-to-date information tailored to your business’s needs.
Additionally, our software’s multi-dimensional analysis feature lets you drill down into your financials, offering a clear and comprehensive overview without manually sorting through transactional data. With real-time data at your fingertips, you can quickly address issues and share timely, reliable insights with your stakeholders to enable informed, strategic decisions.
Save days on month-end close and drive greater innovation
Achieving a smooth month-end close is easier than ever with our automated, consolidated processes. Our purpose-built solution simplifies financial data consolidation for multi-entity businesses, automates reconciliation, and generates real-time reports effortlessly. By optimising these tasks, finance teams can reduce errors, save time, and enhance growth, leading to greater fulfilment for finance professionals at all levels.
Ready to transform your month-end close with AccountsIQ? Book a demo today and see how our powerful accounting software can simplify your financial operations and drive better business outcomes.

AccountsIQ founder, Tony Connolly, moving to the role of Executive Group Chairman, where he will continue to oversee business strategy. Previously serving as Chief Operating Officer, Darren has been with AccountsIQ for over 12 years
AccountsIQ, the cloud-based accounting software for mid-market organisations, has today announced the appointment of current COO Darren Cran as its new Chief Executive Officer.
Darren has been with AccountsIQ for over twelve years, joining when the company had just 14 employees and has played a key role in scaling the business to over 90 employees supporting more than 20,000 users worldwide. A Chartered Accountant who trained with KPMG, Darren’s career in finance and industry prior to joining AccountsIQ involved senior finance positions at Kefron, Crowe, and IRBC, with a heavy focus on systems.
Current CEO and Founder Tony Connolly is transitioning to the role of Executive Chairman at AccountsIQ Group, where he will focus on strategy as the group continues to evolve the functionality it offers to its customers while entering new markets and expanding internationally.
Tony commented: “The task of choosing my successor as CEO was an easy one. Darren joined AccountsIQ 12 years ago when we were a small team and he has played a key role in our growth and innovation. With AccountsIQ in his DNA, I have every confidence that he will continue to drive the business forward as CEO. We are both very committed to delivering excellence using the best technology and resources at our disposal to make AccountsIQ a world class product and service for our growing user base.”
“As COO Darren headed up Customer Success, which has been a vital component of our success, with onboarding and support services consistently achieving 97%+ customer satisfaction rates. This is recognised by AIQ being shortlisted for Best Digital CX at the International Customer Experience Awards. Darren also played a key role in securing our recent Series C investment round of €60 million from Axiom Equity, demonstrating his vital role in shaping the company’s future.”
Darren Cran, CEO at AccountsIQ, added: “I’m honoured to take on this role and continue working alongside Tony and the fantastic team we’ve built over the years. I’ve seen firsthand how the company has evolved into an international business supporting thousands of organisations. We have done this by staying close to our customers and partners. Our mission remains clear, to empower finance teams to navigate their digital transformation journey with the latest easy-to-use technology.”
“We have exciting plans ahead, including significant developments in our product roadmap, which we’ll be announcing in the coming weeks,” Darren continued. “These developments will reflect our ongoing commitment to innovation and providing high value, easy-to-use solutions to finance teams and their colleagues. I look forward to leading the next chapter of AccountsIQ’s growth.”

Automated data capture plays a vital role in improving efficiency, accuracy, and scalability across financial management operations. In this blog, we explore the importance of selecting the right data capture solution and why AccountsIQ stands out as the most robust option for businesses ready to scale through automation.
As businesses continue to grow, streamlining operational efficiency becomes critical, requiring multiple processes to change in rapid succession. Manual tasks need to be eliminated to free up time, and it becomes quickly apparent which complex financial tasks can be simplified and sped up using automation and other tools.
Automated data capture plays a vital role in improving efficiency, accuracy, and scalability across financial management operations. In this blog, we explore the importance of selecting the right data capture solution and why AccountsIQ (AIQ) stands out as the most robust option for businesses ready to scale through automation.
Automating data capture can transform how businesses handle information, reducing time spent on tedious manual data entry while dramatically improving accuracy and productivity. For scaling businesses, this can ultimately support long-term growth, freeing up resources to focus on strategy rather than gruelling administrative tasks.
Optimising data capture for growing companies should focus on seamless integration with broader business systems – whether it’s CRM, POS/ePOS, or inventory management systems – ensuring that data flows smoothly between them.
At AIQ, we offer a standout solution by automating data capture across multiple touchpoints, providing a real-time view of financial insights that drive smarter decision-making and operational efficiency.
To put it simply, mid-market and growing businesses must look beyond basic functionality when choosing a sufficient data capture solution. For fast-growing, mid-sized enterprises, selecting the right platform is critical to maintaining scalability while staying efficient.
Here are a few factors to consider:
One of the core features of automated data capture in AIQ is its Optical Character Recognition (OCR) technology. Designed to handle complex business needs, AIQ’s OCR capabilities allow businesses to automate the extraction of information from invoices, reducing errors and the time spent on manual data entry.
This functionality adds substantial value by streamlining and centralising the purchase-to-pay process. AIQ’s intelligent system automatically matches purchase orders (POs) raised within the platform to incoming detailed, multi-line-item purchase invoices (PIs), enhancing operational efficiency and minimising the risk of manual mistakes.
In addition, AIQ’s OCR system automatically assigns General Ledger (GL) accounts and Business Intelligence (BI) codes based on matched PIs, ensuring greater accuracy and speed. By integrating this feature within its broader financial management system, AIQ eliminates the need for multiple automation tools, making it an ideal solution for businesses looking to consolidate their tech stack while optimising financial workflows.
Our native OCR solution is designed to streamline workflows, minimising the need to switch between multiple applications for most day-to-day tasks. However, for more complex or specialised AP-related requirements, advanced tools like Lightyear can offer enhanced capabilities. In such cases, AIQ excels through its seamless integration, effortlessly connecting with external solutions to provide a comprehensive and flexible approach that addresses diverse business needs without sacrificing efficiency.
Integration is a critical factor in enhancing the efficiency of capturing data. AIQ stands out by offering both open API options and custom-built integrations developed by our dedicated team. Utilising our robust, well-established integrations with CRMs, sales platforms, and other cloud tools, we ensure seamless connectivity and real-time data accuracy. Additionally, we can host custom-built integrations if required, to meet specific operational needs.
With AIQ, data captured from various sources is mapped directly into the system without manual intervention. Moreover, the APIs can be tailored to the unique needs of each business, offering bespoke, scalable solutions that evolve as the business grows.
The reliability and scalability of AIQ’s API integrations reduce time spent on manual processes and offer cost-effective solutions to data capture, allowing businesses to focus on growth.
AccountsIQ provides a comprehensive, user-friendly expense module designed to streamline the entire expense capture process for businesses. This module includes an easy-access mobile app that simplifies expense entry, enabling employees to quickly and efficiently capture expenses on the go without needing to log into the full FMS.
The expense module enhances accuracy and efficiency in real-time expense capture, offering capabilities that go beyond basic OCR technology. From receipt capture to approval and payment, the module covers the entire expense management lifecycle, eliminating manual processes and reducing errors.
Automating data capture is a critical element for businesses looking to scale efficiently and without complications. AIQ’s built-in OCR capabilities, advanced API integrations, and seamless expense management solutions make it the ideal choice for companies ready to consolidate their tech stack and adopt a comprehensive, scalable solution.
Schedule a demo today to see how AIQ’s cutting-edge automated data capture can revolutionise your finance operations.

Empowering finance professionals at every level, Automation frees up time across the team for deeper analysis, enabling them to provide the insightful input that business leaders require to make informed decisions. Here are the key accounting tasks we believe should be fully automated in order to take your mid-market business to the next level of growth.
Are you looking to future-proof your finance operations? Automation could be the key. Empowering finance professionals at every level, it frees up time across the team for deeper analysis, enabling them to provide the insightful input that business leaders require to make informed decisions. Here are the key accounting tasks we believe should be fully automated in order to take your mid-market business to the next level of growth.
Tasks ripe for automation:
1. Accounts payable: Document scanning and digital storage can eliminate paperwork and significantly reduce manual processing, making invoice management faster and more accurate.
2. Expense management: A mobile expenses app can streamline the expense claim process, allowing employees to submit and track expenses on the go, reducing the administrative burden.
3. Data integration and accuracy: A cloud-based system that integrates with other business systems can minimise data re-entry and errors, ensuring a seamless flow of accurate information.
4. Bank feeds: Automated bank feeds streamline reconciliation by syncing transactions with the accounting system in real-time. This reduces manual data entry, minimises errors, and speeds up reconciliation, allowing finance teams to focus on higher-value tasks. The result is a more efficient and reliable financial management process that supports timely decision-making.
5. Management reporting: Advanced analysis tools and customisable dashboards enable targeted reporting and data filtering by criteria like projects or departments. This automation enhances decision-making by streamlining trend identification, reducing manual sorting, and improving overall financial management efficiency.
6. Consolidated group reporting: Automated consolidation reporting software simplifies the month-end process, reducing the time and effort required for accurate group financial statements.
7. Payroll processing: Integrating payroll software ensures timely and accurate salary disbursements, tax calculations, and compliance with local regulations, reducing manual errors and saving considerable time.
The impact of automation: Why is automation so beneficial for finance professionals?
Automation is more than just a buzzword in the accounting and finance world. It can be the differentiator for organisations striving to balance human expertise with technological advancements amid rapid change. Those who embrace automation will be better positioned to optimise efficiency and retain talented individuals.
For junior professionals, automation means less time spent on mundane, repetitive tasks and more time for strategic thinking and career development.
For senior finance leaders, it brings higher accuracy, enhanced decision-making capabilities, and the opportunity to focus on growth and innovation.
For businesses, automation translates to improved operational efficiency, error-free analytics, and real-time insights that drive better decision-making. This is particularly impactful for mid-market businesses, where resources are often limited, and efficiency can be a significant competitive advantage.
With automation, finance professionals can expect:

At AccountsIQ, we are thrilled to announce our strategic partnership with IRIS Software Group (IRIS), a global leader in accounting, edtech, and human capital management solutions.
At AccountsIQ, we are thrilled to announce our strategic partnership with IRIS Software Group (IRIS), a global leader in accounting, edtech, and human capital management solutions. This collaboration is set to drive cloud tech innovations, offering an integrated suite of cloud-based payroll, HR, and finance solutions that streamline operations, enhance cross-departmental collaboration, and empower businesses with powerful business intelligence tools.
A proven and expanding partnership
Since 2018, AccountsIQ and IRIS have successfully collaborated across various sectors. Building on our six-year partnership, we are excited to extend the availability of AccountsIQ’s advanced financial platform to IRIS Cascade and Staffology customers through the IRIS HR Marketplace. This expansion aims to benefit HR and Payroll customers by providing them with integrated, cloud-based solutions.
Seamless data integration between payroll and finance systems
The out of the box integration provides a flow of Staffology and Cascade payroll data directly into AccountsIQ, providing businesses with a unified cloud-based solution for payroll, HR, and finance that covers the entire employee lifecycle. This integration enhances operational efficiency and delivers actionable business intelligence insights.
Key benefits of the integrated cloud HR, Payroll and Finance system
Real-time Financial Performance Monitoring: Our intuitive dashboards provide detailed data analysis of financial performance, enabling businesses to make informed, data-driven decisions and swiftly adapt to evolving financial conditions.
Simplified Regulatory Compliance: Our platform simplifies VAT returns, corporate tax filings, and Companies House submissions, ensuring businesses remain compliant with current and future regulatory requirements.
Enhanced Accuracy and Streamlined Operations: By integrating payment authorisations and approvals into a single system, we reduce manual data entry, facilitate multi-currency transactions, ensure consistent data accuracy across functions, and strengthen financial governance.
Comprehensive Budget Management: Full audit trails support superior cost control and performance oversight, making it easy to authorise payments and invoices, and manage and consolidate invoices across multiple entities.
Real-world impact: insights from industry leaders
Steve Allen, Financial Director at IFX, emphasised the transformative role of AccountsIQ in their business growth:
“Our growth soared by 110% the year before last, a feat we attribute directly to AccountsIQ. Had we still been using Sage 50, our growth would have been stunted or, at the very least, would have required a significantly larger finance team.”
Building on this, Stephanie Coward, Managing Director of HCM at IRIS, shared her excitement about the collaboration:
“We are thrilled to introduce AccountsIQ as a strategic partner in IRIS' HR Marketplace. This partnership enables our customers to leverage a fully integrated, cloud-based suite of payroll, HR, and finance solutions, ultimately saving them time, improving cost control, and boosting profitability.”
Tony Connolly, Founder and CEO of AccountsIQ, highlighted the broader impact of this collaboration:
“We're enthusiastic about advancing our partnership with IRIS. By integrating HR, finance, and payroll solutions, we streamline processes and save time, allowing users to focus on growing their businesses. This expanded collaboration offers a fantastic opportunity for both AccountsIQ and IRIS to deliver a more unified and efficient service to our clients.”
Looking ahead: expanding opportunities
With AccountsIQ now available to Staffology and Cascade business customers, we are planning to expand its integration across IRIS’ accounting division products. This initiative will further enhance the unified service offering, providing even more businesses with powerful, integrated solutions for their payroll, HR, and finance needs. To learn more about the IRIS and AccountsIQ partnership, visit the IRIS HR Marketplace.
AccountsIQ, the cloud-based accounting platform, has secured a €60M Series C investment from Axiom Equity, a B2B SaaS growth equity fund. This investment will drive the development of AccountsIQ's product, leveraging AI advancements to shape the future of finance.
AccountsIQ, the cloud-based accounting platform, today announced that it has secured a €60M Series C investment from Axiom Equity, a specialist B2B SaaS growth equity fund. The investment will be focussed on continuing to develop the AccountsIQ product to shape the finance function of the future, taking advantage of advancement in AI throughout all aspects of the solution.
AccountsIQ provides a financial management system (FMS) Software-as-a-Service designed to transform the finance function, solving complex problems like multi-currency consolidation, multi-level approvals, third-party integrations, and automation of daily processes. It empowers finance teams to collaborate digitally with stakeholders in their businesses by giving the right information to the right user at the right time, enhancing the financial IQ of the organisation so it can make better decisions.
This investment will enable AccountsIQ to move to the next level of its development as a leading international FMS, growing its resources to more than double its team to over 200 people over the next few years and enhancing its AI capability to deliver even more value to its diverse customer base.
Tony Connolly, Founder and CEO of AccountsIQ, commented, “Having hit a critical milestone with over 1,000 customers, we are now poised to take the AccountsIQ product and service to the next level. This investment comes at a perfect inflection point for our offering, to allow us leverage AI tools into practical, easy to adopt services for our user base; to make finance team roles more flexible, valuable, less repetitive and indeed more interesting.”
Martin Wygas, Founding Partner of Axiom Equity, added, “We were immediately impressed when we met the AccountsIQ team and saw the product and its positioning. The deep understanding of their customer base and forward-thinking vision deeply resonated with our team. Recognising the potential to accelerate AccountsIQ’s product development with additional capital and expertise, we are excited to be partnering with them to scale AIQ to the next level.”

In the last six months, AccountsIQ has chalked up no less than three UK business awards and been shortlisted for a fourth.
In the last six months, we’ve chalked up no less than three UK business awards and been shortlisted for a fourth. Our most recent win at the UK Business Award 2024 — Accountancy Awards honoured our “Outstanding Contribution to the Accountancy Profession”. It is a great achievement to be recognised by the accounting community for the work we’ve done to break new ground, transforming the way finance teams, CFOs and accountancy practices work with emerging technology.
Our goal has always been to continually improve and streamline accountants' processes to better serve their clients, as well as helping in-house finance teams find a new level of productivity. AccountsIQ automates entire accounting processes end-to-end, such as accounts receivable, accounts payable and bank reconciliation. Introducing digital processes to the accounting community significantly saves time, reduces error, improves business intelligence and allows accountants to do more strategic work. To achieve this, we use automation technology extensively in our core accounting product and continually extend the range of ready-made integrations with some of the most widely used cloud apps for payment, expenses, CRM and document management.
AccountsIQ has been supporting franchise businesses since its earliest days. For franchisors, having a pre-configured, template accounting system for each franchisee brings consistency and speed of implementation for a relatively low cost of ownership. For franchisees, starting out with a pre-configured accounting system that’s tailored to the exact needs of the business makes onboarding simple and quick.
We’ve also been recognised for innovating on delivery and were awarded the Silver prize in the ‘Best Digital Transformation Journey’ category at the UK Customer Experience Awards in the last quarter of 2023. The award celebrates a digital transformation project of our own that aims to guide customers through education, implementation and ongoing support. The AIQ Academy e-learning portal gives ‘on-demand’ training on all product features in role-based learning pathways.
Making the finalist shortlist for the UK Fintech awards is also worth a mention. We presented the panel with examples of our inventiveness that stems from combining robust, enterprise-grade accounting software with integrations, automation and business intelligence tailored specifically to customers' needs. Our software is innovative, not just in functionality, but in how we deliver it based on each client's unique finance requirements and objectives. Making the shortlist in this tough category is proof of our strength in combining leading technology with consultative, outcome-driven implementation.
Our product roadmap is shaped directly by research into our customers' deepest challenges and emerging needs. Through the years, we’ve pioneered innovative features – like multi-entity consolidation, custom drill-down reporting and embedded global payments – based on this customer intimacy. Ultimately, we aim to counter challenges around complex integrations, siloed business units, manual reporting and limited insights. If you’re struggling with any of those problems, we can help. Just get in touch.

For tech companies and startups, having an agile, efficient, and insightful financial reporting system is critical. This is where AccountsIQ’s cloud-based accounting software solution becomes a game-changer.
In the tech industry, the ability to make informed, strategic decisions quickly can mean the difference between leading the market and falling behind. For tech companies and startups, having an agile, efficient, and insightful financial reporting system is critical. This is where AccountsIQ’s cloud-based accounting software solution becomes a game-changer.
By choosing a robust cloud accounting solution, your finance team will be empowered by advanced reporting capabilities that drive better business decisions. Here’s how AccountsIQ’s intelligent features are essential to help you grow your business in the tech space.
For tech companies, leveraging real-time data is crucial for staying competitive. AccountsIQ’s cloud accounting software offers smart reporting structures that enable you to monitor and allocate growth and profitability according to your ambitious and ever-evolving business targets.
Your finance team can instantly access real-time data through preconfigured dashboards, allowing you to swiftly obtain narrative insights and review KPIs at a glance. This rapid access facilitates faster and more informed decision-making, which is crucial when you need to adapt quickly to market demands and internal performance metrics.
By simplifying complex accounting, providing real-time data through role-based dashboards and offering integrated reports, AccountsIQ gives you the ability to deliver accurate, timely insights. This enables strategic decision-making, keeping you agile and responsive to market changes.
Tech startups and companies often face complexities in operating across various regions, especially when handling multiple currencies. AccountsIQ streamlines inter-company accounting, facilitating seamless management of multiple entities and ensuring error-free period closes with real-time reporting for precise financial records. Advanced analytics, like the six-dimensional BI coding structure, allow you to monitor Monthly Recurring Revenue (MRR) and Annual Recurring Revenue (ARR) by product and region, helping you to manage foreign exchange risks and aligning your financial strategies with wider business goals.
As a tech company, we know you often rely on multiple applications to manage your operations. AccountsIQ stands out against competing solutions thanks to our open API, which integrates seamlessly with existing systems including CRMs, financial analysis tools and investment management platforms.
This creates a centralised data hub, ensuring consistent and accurate financial information for your business. By housing this data in one central location, you and your finance team benefit from improved and more reliable reporting, enhanced strategic decision-making abilities and overall improvement to your financial performance.
Automation drives efficiency and innovation in tech companies. AccountsIQ boosts operational performance by automating tasks like purchase orders, approvals, expenses, and bank feeds. It supports multi-currency transactions and multi-entity consolidation, allowing you and your team to focus on strategic analysis instead of administrative work. This not only saves time but also reduces human error, ensuring more accurate financial data.
AccountsIQ offers a perfect solution for growing tech businesses that need advanced, unrestricted features. Its six-dimensional BI coding structure and advanced analytics provide deeper insights and precise control over financial data.
With a commitment to continuous innovation, AccountsIQ is the accounting software that can grow with you and support you on your growth journey. Our solution ensures you have access to the latest technology and features while also providing substantial time savings and reducing costs.
Advanced integration with existing systems minimises disruption, while comprehensive support and a user-friendly interface make AccountsIQ an optimal choice for tech companies aiming to enhance their financial operations.
Having the right accounting software can significantly impact your team's productivity and success. AccountsIQ stands out as a leading accounting software solution, offering not only robust features but also an award-winning onboarding, training, and ongoing support.
Having the right accounting software can significantly impact your team's productivity and success. AccountsIQ stands out as a leading accounting software solution, offering not only robust features but also an award-winning onboarding, training, and ongoing support.
Our featured blog this month highlights AccountsIQ's exceptional achievement in digital innovation, earning the Silver award for "Best Digital Transformation Journey" at the 2023 UK Customer Experience Awards. We'll discuss how AccountsIQ is a standout solution, offering mid-sized businesses a tailored onboarding process, comprehensive training, dedicated support, and continuous feature updates. When compared to conventional platforms like Sage 50 and Xero, AccountsIQ is committed to advancing digital accounting solutions, not just meeting but exceeding current business needs and defining new standards in finance technology.
AccountsIQ is committed to providing a seamless onboarding experience for its clients, ensuring a smooth transition onto the new platform. Our highly experienced professional services team includes qualified experts in accounting, technology implementation and support. They will work with your team to deliver a detailed accounting software implementation plan. We can get you up and running in 4 to 6 weeks.
AccountsIQ is devoted to ensuring your team's smooth transition to digital financial management with a bespoke training approach, catered to medium-sized businesses and bolstered by our extensive e-learning provision, AIQ Academy. Mindful of the shifts towards hybrid and flexible practices, we have developed our educational offerings to be as adaptable and accessible as today's work models demand.
Our training programmes span from fundamental principles to the complexities of sophisticated features and are delivered through AIQ Academy's targeted video modules, which are concentrated for maximum impact. These modules, along with practical exercises and assessments, facilitate a self-paced, comprehensive learning experience, enabling the adoption of complex functions such as Group Consolidation. This dual educational strategy ensures that your team is not only equipped but also confident in maximising the capabilities of our software, enhancing productivity and efficiency within the intricacies of modern financial management.
At AccountsIQ, support doesn't end after the onboarding and training phases—it's an ongoing commitment. With an average response time of just 20 minutes, our dedicated support team is readily available to address any questions or concerns promptly. We understand the importance of continuity, which is why we strive to assign the same personnel to your company, building familiarity and streamlining communication.
Additionally, clients benefit from a dedicated Customer Success Manager whom they can book time with for any questions or feedback about the system. This personalised approach ensures that your needs are consistently met and that you have a trusted point of contact for ongoing support and guidance.
AccountsIQ empowers ambitious medium-sized businesses with award-winning onboarding, training, ongoing support, and innovative features. So why settle for anything less? Experience the AccountsIQ difference.. Book a demo with our experts today.

With AccountsIQ, multi-entity companies can capture, process and report their Group VAT quickly and easily and with full confidence they are complying with MTD.`
Many of our UK-based multi-entity customers find it is beneficial to register for Group VAT via HMRC’s Making Tax Digital (MTD) scheme. This is why we have simplified and streamlined the process even further.
Here's a quick overview of the potential benefits of Group VAT Registration*:
*We strongly advise you to seek professional tax advice before forming a tax group, as there may also be potential downsides.
With AccountsIQ, multi-entity companies can capture, process and report their Group VAT quickly and easily and with full confidence they are complying with MTD. Remember, HMRC’s ‘digital link’ specification also applies to the calculation and submission of Group VAT. This means that there needs to be a direct link between your accounting system and HMRC; no manual rekeying or copying and pasting of data is allowed.
The AccountsIQ platform has a direct link to HMRC, alongside ensuring you have a full audit trail of your Group VAT returns.
To simplify and streamline this process even further, we’re redesigning and modernising our existing Group VAT functionality. The main improvements are:
1. More visibility
On the new Group VAT Return you’ll see the live status of the individual VAT Returns of all the companies in your VAT Group. That makes it easier for you to know exactly when your Group Return is ready for review and submission to HMRC. You can also see the breakdown of each entity’s VAT directly in your Group VAT Return.
2. Built in compliance controls
Our compliance features prevent anyone from submitting your Group VAT Return until all the individual returns have been completed. Once submitted, your Group VAT Return is locked. That means no-one can edit either the group or individual company returns.
These Group VAT updates are just one example of the range of product improvements we’re launching to make life easier for finance teams in multi-entity and growing companies.
If you’re a current AccountsIQ customer, don’t forget that QHub is the place to go if you need any help or support at any time. In just one click, you’ll have access to everything you need throughout your AccountsIQ journey. From onboarding and on-demand training to chatting to our Support Agents or booking a slot with your Customer Success Manager – you can access it all from the ‘Q’ link on your AIQ screen.
If you’re not yet an AccountsIQ customer but have questions, or just want to find out more about how we could help your finance function be more efficient and effective – get in touch.

Exciting news for AIQ clients! We are thrilled to announce that AIQ Academy, our client-centric learning hub, is now officially CPD certified. This means that you can now earn valuable CPD points upon completion of our AIQ Academy courses.
Exciting news for AIQ clients! We are thrilled to announce that AIQ Academy, our client-centric learning hub, is now officially CPD certified. This means that you can now earn valuable CPD points upon completion of our AIQ Academy courses. As one of the first online education providers to offer CPD accreditation options in our industry, we take pride in empowering our users with recognised professional development opportunities.
CPD (Continued Professional Development) is not just a fancy acronym—it's your passport to personal excellence and recognition worldwide. As a globally recognised certification service and industry standard, CPD can level up your professional skills and unlock new opportunities for growth and success.
There are many benefits to becoming CPD certified, say for example, being more efficient with one’s time. When you complete courses via the AIQ Academy:
All AccountsIQ platform users can acquire CPD points after completing each course–and there are more than 20 to choose from.
Once a course is completed via the AIQ Academy, a completion certificate containing a CPD logo and the number of CPD hours/points is generated and sent to your registered email. It’s that easy!
Log on to the AIQ Academy and get started!

Fully integrate your tech-stack with AccountsIQ's customised accounting software integrations. Benefit from full visibility and accurate data syncing between your systems.
Many finance teams dream of a fully integrated tech-stack where information flows smoothly between your finance and other business systems. Imagine, no data entry duplication, full visibility, more accurate cash-flow forecasting and reliable, timely management reporting. Well, this is no dream.
We’ve invested in making our customised accounting software integrations service do all that. We’ve also made it as flexible and user-friendly as possible. Here are two reasons we think this makes it unique:
If you don’t see the system you want to integrate with on our Accounting Software Integration Partners page, just talk to us. For example, a rapidly expanding restaurant group, Camile Thai, worked with our Integrations team so they could integrate AccountsIQ with MarketMan (a restaurant inventory management system). This gives them essential granular business intelligence information.
“We love using AccountsIQ. And I’m delighted with the way the integration’s worked. The AccountsIQ team were super-responsive; they helped us to map out what we needed and worked around our schedule to keep the project on track.”
Eoghain Grant, Financial Accountant, Camile Thai
We customise the integration to meet your individual needs. We have a team of accounting software integration experts who are always on hand to help. They sit down with you to work out what’s important to your business and suggest ways we can work together to manage it all.
Pete McKeown, Systems Integration Specialist with AccountsIQ explains:
“We talk to customers to understand their pain points and spec out what they want. That means we can design and configure the integration for customers’ specific processes and workflows. We strive to make it do exactly what they want it to do.”
“For example, recently a customer said they wanted to invoice from Salesforce. Their data wasn’t structured in the optimum way to do this, so we helped them to design a bespoke invoice solution in Salesforce. We also provide a cost/benefit analysis so they can make the business case internally for an integration that will improve their productivity.”
Our Integrations team then co-ordinate with our Onboarding team to ensure you have your business-critical integrations up and running from day 1. They can also work with you on an on-going basis. Customers often come back to us post go-live because they want to integrate another system with their AccountsIQ platform.
“The integration and the API are what we’ve been really happy with. We have developers in house who roll their eyes when you talk about the other larger accounting software vendors because they are so cumbersome. Our team found it really easy working with AccountsIQ to get it all up and running. That’s what really sold us.”
Helen MacDonald, Finance Manager at Cyber Security experts, PortSwigger.
The business world never stands still. As your company grows and your needs become more complex, you’ll probably want to introduce new systems to your tech stack. Our Integrations team will always be on hand to consult and advise on integrating new software, processes and workflows into AccountsIQ.

CFOs need business and financial data that’s timely, reliable and structured. Every finance team needs these nine management reports at their fingertips.
The finance role isn’t just about processing paper and transactions. It’s about stepping back, looking at the data and key drivers, and opening up new opportunities across the business.
To achieve that shift, CFOs need broad business, not just financial, data. And it must be timely, reliable and structured. Here are nine management reports every finance team should have at their fingertips.
Always top of any finance team’s list! Around 80% of businesses fail due to lack of cash. But proper cash flow forecasting enables you to predict when issues may arise – and take action.
Where are your future sales coming from? How many new customers are in the pipeline, what’s the probable conversion rate, timeline and value? These numbers will feed into your overall cashflow forecast.
The bread and butter of every CFO reporting period. You’ll need a consolidated top-down view of your financial position and segmented past performance of business units, products and channels. This will help your management team make better, more informed decisions.
This sub-section of the consolidated and segmented P&L goes deeper. It gives greater insights into what is working well (or not!) and helps you spot trends and opportunities.
Reporting on the progress of specific business objectives keeps everyone focused on your strategy.
Early awareness of risks is often enough to set the right plan in motion to weather the storm. Every business needs a register of risks with likelihood rating, impact and proposed mitigating responses.
This is essential for benchmarking. It means you can identify which parts of the business are providing the greater contribution and where you might be able to apply lessons across the business.
The exact metrics you need to understand your customers will vary depending on your business. They are likely to include: customer acquisition cost by channel, spend by customer, repeat orders, customer satisfaction or NPS scores and churn rates.
There are many ways to measure productivity and, again, the metrics you choose will depend on your business and sector. But benchmarking will help you understand and monitor efficiency gains across multiple processes and departments.

You can delete all those ‘New Year, New You!’ messages crowding your in-box. It’s too much pressure. No-one needs that. One area that is worth reviewing is your accounting software. As your business grows and evolves, your starter accounting software can struggle to cope.
You can delete all those ‘New Year, New You!’ messages crowding your in-box. It’s too much pressure. No-one needs that.
One area that is worth reviewing in 2023 is your accounting software. As your business grows and evolves, your starter accounting software can struggle to cope.
If your company grows fast, you can quickly find yourself processing hundreds of thousands of transactions every month. You’ll need to make sure your finance system can cope.
You can free your time and keep on top of your finances. Smarter, automated workflows and authorisation processes will boost efficiency and eliminate the risk of inaccurate data entries on multiple spreadsheets.
Your management team needs to make crucial business decisions, fast. You can drive that process by delivering real-time, accurate management reports direct from your finance system.
Consolidating the accounts for a group of companies can be one of the most challenging tasks for a finance team. But it doesn’t have to be. Combined accounting and group consolidation software makes consolidating a breeze, with no more complicated workarounds.
You’re probably using multiple systems across your business. Just think how much more efficient it would be if your finance system seamlessly integrated with your CRM, booking system or payroll, or even your on-premise systems.
AccountsIQ is an ideal next step up from starter Cloud and older on-premise accounting systems. You’ll be able to automate manual accounting tasks and quickly deal with more complex finance processes, such as multi-currency consolidation and inter-company transactions. You’ll also be able to deliver accurate and actionable business intelligence to your management team.
“The year before last we experienced 110% growth. We could not have done that without AccountsIQ. We would have collapsed or, at the very least, we would have needed a much bigger finance team.”
Steve Allen, Group Finance Director, IFX Payments
How to take the stress out of month-end close for finance teams

When a company trades in goods or services overseas, or makes international inter-company transactions, it needs to minimise or mitigate the associated financial exchange risks.
When a company trades in goods or services overseas, or makes international inter-company transactions, it needs to minimise or mitigate the associated financial exchange risks. It used to be that only large multinationals had to worry about exposure to foreign exchange fluctuations. But the increasingly international nature of business means it’s now a reality for many mid-market companies.
Companies incur foreign exchange risk when they engage in financial transactions in a currency other than their domestic currency. The risk is that exchange rates can move in ways that mean your company loses money. This risk is also known as FX risk, exchange rate risk or currency risk and the amount at risk is called exposure.
There are broadly three types of FX risk exposure:
In the complex world of international trade, multiple internal and external risk factors come into play. These include:
Internal risk factorsExternal risk factorsLack of financial visibility, particularly over cashflow and liquidityCurrency volatilityInaccurate forecastingChanges in interest ratesSiloed dataSupply chain disruptionsRelying on Excel to manage complex FX accountingGlobal events, such as a pandemic, war or political instability
Many of these external risk factors are difficult to foresee, and impossible to control. However, gaining financial transparency and visibility across your business and supply chain will help you to put effective FX policies in place to mitigate hidden or unexpected FX risks. Many finance teams also chose to work with an FX provider to reduce risk, save money and ease the administrative burden.

The spot exchange rate is the current amount one currency will trade for another currency at a specific point in time. It’s often referred to as the open market price or transaction rate. Typically, it’s the rate recorded in the P&L account.
If you buy and sell currency, for example you receive dollars into a euro account, you will automatically receive an – unattractive! – spot rate from your bank. In reality, most companies don’t do this. Instead, they practice what is called ‘self-hedging’. This normally means they will either:
1) Pay expenses, such as software subscriptions, advertising or travel, in another currency using a credit card
2) Need to pay suppliers in different currencies
In these first two situations you are effectively paying the spot rate.
3) Need to repatriate profits from an overseas subsidiary. This treasury movement is the main FX challenge facing many businesses. It’s also where establishing a relationship with an FX provider is particularly beneficial; both for accessing a good spot rate and for hedging.
FX fees are another opportunity for finance teams to make significant savings. Banks will typically charge an FX fee of 200-500 basis points (2-5%). However, if you establish a relationship with an FX provider, either independently or through an accounting software partner, you can typically guarantee a charge of around 50 basis points (0.5%).
A hedge is like an insurance policy to help manage risk by minimising or offsetting your exposure. You’re also gaining certainty by limiting your exposure to FX movements. For example, if a foreign subsidiary is budgeting to trade a USD1m profit and the group reporting currency is GBP, it might be wise to hedge part, or all, of the FX exposure if the plan is to repatriate part, or all, of the profits.
This scenario would use a European Option (see below) to sell forward an amount of USD for GBP for an agreed future rate your company is comfortable with. The same would apply if the subsidiary was planning to repay a loan to group.
Another situation that often arises is making an investment or loan into a subsidiary. Here, you would be looking to buy forward, say USD, to make an investment at a future date.
Having access to the data to identify and understand your FX exposures is key to good Treasury Management. How you then use a good spot rate or hedge forward, will determine how much you minimise the FX transaction costs, or reduce the risks of adverse movements through forward contracts (hedging). If you are dealing in FX transactions of £500,000 or higher it could be costing your business £15,000 a year.
Foreign exchange options can help companies hedge against exchange rate fluctuations. They are derivatives that give the right (but not the obligation) to exchange one currency into another at a pre-agreed exchange rate at a specified time. There are multiple types of FX options, but the two most common are:
Here’s a simple FX risk scenario example:
Your US subsidiary is forecast to make a $4M annual profit but the dollar is expected to weaken over the year. To mitigate your currency exposure, you decide to fix, or hedge, your Q1 $1M forecast profit. This hedging allows you to move the money at the locked-in rate and avoid FX exposure. Alternatively, you could hedge half your exposure ($0.5M) to reduce the impact of any major currency swings.

Finance teams operating in a multi-currency world are typically either:
1) Trading in multiple currencies within a single entity structure
2) In a group structure with the parent company reporting in one currency and subsidiaries trading in other currencies.
As such, they face multiple day-to-day accounting complexities including:
- Manage FX transactions in your P&L
- Conduct balance sheet revaluations
- Compare against fixed, or variable, budgets.
Amongst all the uncertainty around rising interest rates, inflation and world events, one thing is certain. CFOs cannot neglect FX risk management and its influence on the balance sheet. Yet, according to research from American Express*, 43% of UK SMEs don’t actively manage the risk posed by foreign currency fluctuations.
*American Express/YouGov survey of 1000 UK SMEs, July 2019.
1) Have the right finance technology in place
If you’re trading in different currencies, you need a Financial Management System with treasury management capabilities built in. Managing the accounting complexities we’ve outlined above in Excel is hugely time-consuming and error prone.
2) Ensure you have a reliable data source
Comprehensive and real-time data is key to understanding your FX exposures. You’ll also need a reliable data source if you’re using hedging instruments to manage FX exposure. That’s why it’s essential to collect and seamlessly integrate data from all your business systems.
3) Work with an FX partner
Streamlining and automating international payments, processes and workflows can help manage FX risks and costs. For example, AccountsIQ integrates with the global payments company TransferMate. This means businesses can access competitive spot rates and generate international payments directly from their finance system for faster settlement time.

Darren Cran, COO, AccountsIQ
Managing FX risk effectively is crucial for international businesses. As AccountsIQ’s COO, Darren Cran, explains:
“We’re living in what is often referred to as VUCA* times. Multiple disruptive events are happening at the same time around the world. That, inevitably, leads to additional currency volatility.
We’re seeing that with all the major currencies; but it’s even worse with secondary currencies. In this business environment, having a robust treasury management approach is vital. Essentially, that involves ensuring you get the best spot rates and have a hedging strategy in place.”
*Volatility, Uncertainty, Complexity and Ambiguity

Every CFO has many and varied responsibilities. But running the finances of a private equity portfolio often involves an even broader range of disciplines, challenges and relationships. So what separates private equity CFOs from the rest?
Every CFO has many and varied responsibilities. But running the finances of a private equity portfolio often involves an even broader range of disciplines, challenges and relationships. So what separates private equity CFOs from the rest?
Here are 3 extra complexities of private equity finance – and how to deal with them.
All CFOs are responsible for financial reporting. But the depth and pace of reporting in PE funds can come as a surprise if you’re a CFO new to the sector. For example, a 5-days-or-less monthly close is often a requirement. You’re also likely to have to deal with:
In addition to the monthly close, many PE funds require daily or weekly dashboards showing performance against multiple financial and operational KPIs. Partners or other stakeholders will demand financial visibility and business intelligence to monitor, assess and manage risk across a complex portfolio. They’ll also need to be confident that they’re basing decisions on ‘one version of the truth’ across your portfolio of SPVs.
These reports could take the form of a management pack, dashboard reports or PowerBI reports. Here’s an example of how a private equity firm might set up their multi-dimensional reporting and analysis in AccountsIQ.
As finance chief for a complex portfolio of multiple funds/SPVs you can quickly find yourself drowning in spreadsheets for each entity. When you add in the complexities of inter-company transactions, minority interests and FX re-evaluations, you can easily be spending a week (or more) every month just producing consolidated reports. With AccountsIQ, it’s just one-click to perform your consolidation as often as you need.
“I don’t know of any other system that can do consolidation the way AccountsIQ can. It takes the complexity out of everything and saves us a lot of time. It used to take two weeks to do our accounts; now with AccountsIQ, and other improvements, we get our accounts out in five working days.”
Wayne Copeland, Head of Finance, AES International
Read our AES International case study to find why they chose AccountsIQ to make it easier to consolidate their multiple entities and produce bespoke management reporting packs.
“Previously, Apera’s group consolidation was done in spreadsheets: data was exported from various systems and in different currencies, then brought together in Excel. AccountsIQ’s accounting and consolidation software means there is no fiddling around in spreadsheets trying to get things to tie. Working in Excel was not sustainable; before AccountsIQ, we had instances where we were struggling to get these reports right, sometimes until 2 a.m.”
Rob Shaw, CFO of Apera Asset Management
Read our Apera Asset Management case study to find out why they chose to move from Xero to AccountsIQ when consolidation became too cumbersome and international jurisdiction requirements became too complex.
Private equity funds are notorious for their FP&A and financial due diligence requirements. You’re likely to be responsible for providing cash flow projections, financial modelling and forecasting to a greater level of detail than in many non-PE companies. Senior leaders will also look to the finance team to provide industry benchmarking and present insights and scenario plans for multiple growth opportunities.
AccountsIQ facilitates this through its open API structure. We can build custom integrations with your existing business systems. We also have a seamless integration established with financial forecasting software provider, Proforecast, that enables you to bring in data from AccountsIQ to monitor and analyse variations and run multiple ‘what if’ scenario plans.
Many private equity finance teams are doing huge amounts of manual data processing. They’ll have to revalue every fund in your portfolio each year, taking management fees, overheads and other expenses into account. They’ll also have to handle inter-company transactions, FX, third-party invoices, expenses and multiple, multi-currency bank reconciliations.
This is also a major strain on your attention and resources. We estimate that at least 90% of these manual SPV accounting tasks can be automated. Here are just a few examples:
“Everything from the VAT to the reporting, has been really quick and easy to implement. The accruals and pre-payment functions and bank uploads all work exceptionally well and save a lot of time. It’s fantastic. The whole team uses the expenses app; they like that they can sit in a restaurant and just take a photo of the bill, upload it and it’s done. AccountsIQ is perfect for the high complexity, low transaction nature of Private Equity accounting.”
Jeremy Paul, CFO, Queen’s Park Equity
Read our Queen's Park Equity case study to find why they chose AccountsIQ to monitor and control the inter-company transactions of their FCA-regulated UK advisory entity and service company.
PE firms are fast changing, high growth environments; they’re generally not in business to stand still or operate in ‘business as usual’ mode. Acquisitions, mergers and new investments, capital restructurings, changes in personnel, the use of external consultants and surge resources are just a few examples of the constant changes CFOs can expect as part of daily life. As a result, you – and your team – will be expected to adapt to revised budgets, forecasts, financial models and structures.
Installing a Cloud accounting platform, such as AccountsIQ, where each SPV is set up as a separate entity gives you the flexibility to expand at pace. This structure means you can add new SPVs to your finance system in minutes. You’re able to incorporate them into the everyday day running of your business straightaway; you don’t need to configure anything.

Renewable energy could power the world by 2050. That could save millions of lives from air pollution, reverse the effects of climate change and secure our energy supply. This means that finance managers in the renewables sector face all the challenges and complexities of a surging industry; raising funds, managing growth and maximising the returns of multiple assets.
Renewable energy could power the world by 2050. That could save millions of lives from air pollution, reverse the effects of climate change and secure our energy supply. This means that finance managers in the renewables sector face all the challenges and complexities of a surging industry; raising funds, managing growth and maximising the returns of multiple assets.
AccountsIQ’s award-winning Cloud accounting software has rapidly become the financial management platform of choice for renewable energy companies who need to:
The manual data entry and processes involved in managing multiple SPVs can be huge and gets more complex as the number of SPVs grow. But processes like raising purchase orders, approving invoices, allocating costs to each asset, handling inter-company/SPV recharges are all tasks that can be automated. In fact, we estimate that up to 90% of manual SPV accounting tasks are ripe for automation.
Justin Ampofo, Finance Manager with global renewable energy provider BayWa r.e, estimates that implementing AccountsIQ has freed up over 20% of his finance team’s time. That’s mainly due to automating key processes, such as expenses and approvals. Automation has also enabled them to go paperless, while maintaining full traceability and reduced human input errors.
AccountsIQ also simplifies multi-currency accounting and inter-company recharging. Global geoscience and consultancy group Getech used to manage their Sterling and US dollar accounting in Excel. Now, with AccountsIQ, the exchange rates are held centrally in the system, with all subsidiaries using common exchange rates and the system automatically handles realised and unrealised gains/losses.
Getech’s Financial Controller, Simon Brown explains:
“AccountsIQ’s currency revaluation feature creates an automatic routine in the system which ensures accuracy in the calculations and reporting. The other aspect of our internal process that has greatly improved since we have implemented AccountsIQ is the inter-company invoicing. AccountsIQ keeps track of what we are invoicing internally; when the invoice is received it registers automatically in the subsidiary accounts.”
Although renewable assets are at a fixed location, your staff are not. AccountsIQ is a Cloud financial management system. This means your team can have complete anytime/anywhere access to real-time financial data. They can work from home or any of your sites and you won’t need expensive, high-maintenance servers in each location. Approval of POs and invoices can be via mobile app and all documents relating to accounts or transactions are stored in AccountsIQ accessible at the touch of a button.
Renewable energy businesses are rarely single entity and often cross into multiple jurisdictions. AccountsIQ enables consolidation of multiple entities in multiple currencies in just one-click. This gives renewable energy finance teams full visibility of group-wide results, including their currency exposure, without the need for complex Excel models to consolidate results. Getech’s Financial Controller Simon Brown says:
“AccountsIQ saves me a week’s worth of work every month end.”
Consolidated reporting is an absolute must for any CFO managing multiple SPVs. Going off-system to manipulate data in Excel gets more difficult as the number of SPVs grow. One-click consolidation of actuals and budgets/forecasts, with proper handling of inter-company balances, accurate FX re-evaluations and multi-dimensional reporting in group currency is a major time-saver.
The advantages of controlling renewable assets via SPV are significant but that doesn’t need to come with the disadvantage of having information spread across individual companies. With AccountsIQ, your team can securely view the results of all your SPVs in real-time, on one platform. Finance Directors can see real-time consolidated results in base currency for all SPVs across multiple jurisdictions. Fincovi provides commercial asset management services to clients in the renewable energy industry and according to their CEO, Ray O’ Neill:
“We adopted AccountsIQ’s financial management software because the key to successful commercial asset management is the ability to see KPIs at a glance across the whole portfolio.”
AccountsIQ give you the flexibility to design and build your reports with almost no restrictions on what, when or how you report. When you have less ‘noise’ in your finance system, you get much better visibility of financial performance. This makes it easier for finance directors to monitor performance, assess opportunities and manage risk across a complex portfolio of SPVs and assets.
Renewable energy assets take time and considerable cost to build. Tracking the cost of the asset before it becomes operational is vital. AccountsIQ’s BI structure allows costs to be tracked easily to individual assets. This can be setup in an SPV from day one or transferred to an SPV once it is completed and ready to become operational. In AccountsIQ you can set up any number of new BI codes and SPVs/subsidiaries in minutes with the BI tracking all the way from the build cost to the operational performance.


.svg)
