


Month-end reporting should give leadership confidence in the numbers.
But in many growing businesses, it creates more questions. The close takes longer than planned. Budget holders challenge which version of the report is right. Consolidation depends on spreadsheets. The board asks for cash visibility, but finance is still checking whether the data is complete.
That pressure isn’t going away. Deloitte’s 2023 survey found that 80% of CFOs expected their companies to embed more automation or digital technologies into operations in 2024. Finance leaders are being asked to deliver faster, clearer insight – without losing control of the numbers.
This is where financial reporting matters.
What is financial reporting?
Financial reporting is the process of collecting, preparing, reviewing, and presenting financial information for a specific period, audience, and purpose. It helps organisations understand performance, financial position, cash movement, risk, and future outlook.
At its simplest, financial reporting includes formal financial statements such as the profit and loss statement, balance sheet, and cash flow statement. In practice, it’s much broader.
It can include monthly management accounts, board reporting packs, budget versus actual reports, cash flow reporting, forecasts, KPI dashboards, consolidated group reporting, and commentary.
The goal is to help leadership understand:
- What changed
- Why it changed
- Whether it matters
- What action is needed next
What are financial reports?
Financial reports are structured documents, dashboards, or reporting packs that present financial data for a defined period, audience and decision.
Some financial reports are prepared for external stakeholders, such as Companies House, HMRC, auditors, lenders, or investors. Others are used internally by CFOs, finance directors, boards, and budget holders.
The right report depends on the reader:
- A department head usually needs controllable costs, budget variance, and commentary.
- A board may need cash, risk, forecast movement, and strategic decisions.
- A group CFO may need consolidated performance across entities, currencies, and reporting dimensions.
Financial reporting vs financial statements: What’s the difference?
Put simply: financial statements show where the business stands. Financial reporting helps leaders understand what to do next.
Financial statements are formal accounting documents that show a company’s financial performance, position, and cash flows. Under IAS 1, a complete set of financial statements includes a statement of financial position, profit or loss, and other comprehensive income, changes in equity, cash flows, and notes.
For UK private limited companies, GOV.UK describes statutory accounts as annual accounts prepared from company financial records, including a balance sheet, profit and loss account, and notes, with other items depending on the company's size and audit requirements.
Financial reporting is broader. It includes the process of preparing, reviewing, analysing, and sharing financial information across the business.
The main types of financial reporting
Different types of financial reporting exist because businesses need different views of performance, control, and risk.
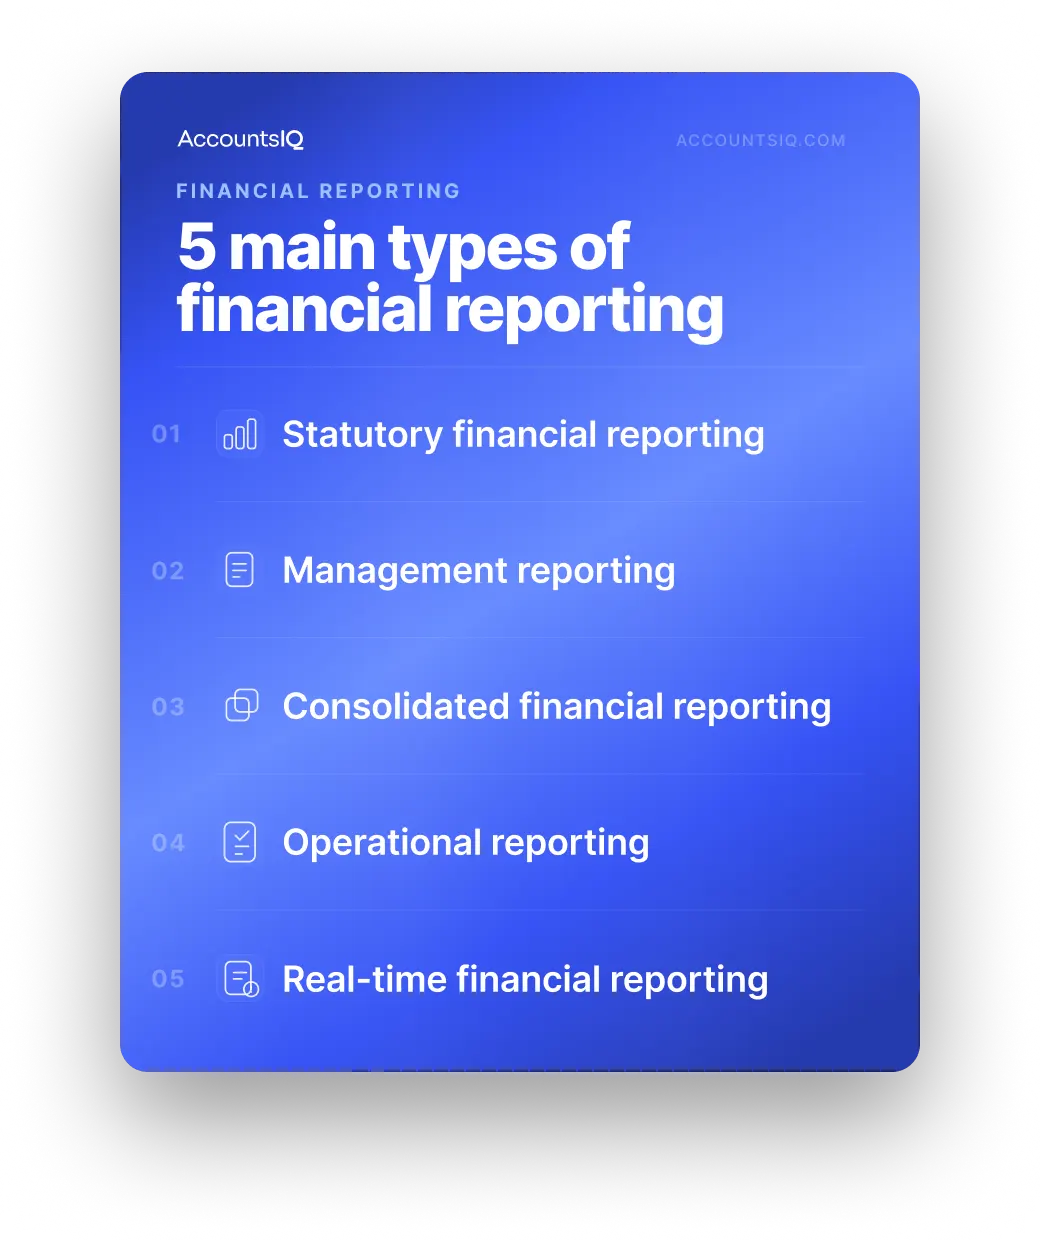
The main types are:
- Statutory financial reporting for compliance and external reporting
- Management reporting for internal decisions
- Consolidated financial reporting for group visibility
- Operational and performance reporting for business drivers
- Real-time financial reporting for live or near-live monitoring
A statutory accounts pack is not built for the same purpose as a monthly management report. A board dashboard is not the same as a cash flow forecast. And a consolidated group report carries a level of complexity that a single-entity report does not.
Statutory financial reporting
Statutory financial reporting focuses on compliance.
It includes formal reports and disclosures a business may need to prepare for external stakeholders, such as annual accounts, tax reporting, and other required submissions.
The audience is usually external: regulators, tax authorities, Companies House or other company registries, auditors, investors, and lenders.
Statutory financial reports are essential, but they’re not designed to run the business day to day.
Management reporting
Management reporting supports internal decision-making.
It usually covers trading performance, budget versus actuals, departmental spend, margin, working capital, forecast movement, cash flow trends, and key financial or operational KPIs.
The value of management reporting comes from interpretation. A good management pack shouldn’t just show that costs increased or revenue missed forecast. It should explain what drove the movement, whether it’s likely to continue, and what decision is required.
Consolidated financial reporting
Consolidated financial reporting combines financial data from multiple entities into one group-level view.
This becomes important when organisations add new entities, acquire businesses, expand internationally or manage group, franchise, fund, or project structures.
Consolidated reporting can involve intercompany eliminations, foreign exchange translation, multiple ledgers, entity-level adjustments, different close timelines, and group reporting packs.
This is where spreadsheet-heavy reporting can often start to strain. A process that worked for one or two entities may become slower, harder to control, and more exposed to version issues as the group grows.
Operational and performance reporting
Operational and performance reporting connects financial results to the business activity behind them.
Examples include revenue by product, margin by customer segment, project profitability, utilisation, sales conversion, inventory movement, headcount analysis, and spend by department or cost centre.
A decline in profit tells leadership something has changed. Operational reporting helps explain whether the cause is pricing, volume, payroll, procurement, customer mix, utilisation, or one-off costs.
Real-time financial reporting
Real-time financial reporting gives finance teams and leadership access to live or near-live financial information.
This can include cash positions, revenue dashboards, budget tracking, departmental spend, rolling forecasts, KPI reporting, and entity or project-level performance.
But faster reporting is not automatically better reporting. Real-time reporting only improves decisions when the data is accurate, metrics are clearly defined, and teams trust the numbers.
What should a good financial report include?
A good financial report should include three things: the numbers, the context, and the action.
The numbers show what happened. The context explains why it happened. The action shows what decision, owner or follow-up is needed next.
The numbers
Most financial reporting packs should include a clear view of:
- Actual performance
- Budget comparisons
- Forecast comparisons
- Prior period comparisons
- Variance analysis
- Cash position
- Balance sheet movement
- Working capital metrics
- Key financial and operational KPIs
A useful report should make clear which period the numbers cover, which entities or departments are included, whether figures are actuals or forecasts, what changed since the last report and which variances need attention.
The context
Numbers without explanation create follow-up questions.
Good financial reporting explains what caused the movement and whether it needs action.
For example, saying “payroll costs increased by 11%” is useful, but incomplete.
A stronger explanation would be:
“Payroll costs increased by 11%, mainly due to planned hiring in the sales and customer success teams. The increase was expected, but lower-than-planned utilisation means the margin impact is higher than forecast. Finance recommends reviewing hiring phasing before approving further headcount.”
That gives the reader the number, the reason, the commercial impact, and the next decision point.
The action
Strong reports highlight what needs attention, who owns the next step, and how the issue affects future performance.
That may include recommended actions, decisions required, owners, deadlines, forecast implications, and follow-up points.
If cash flow is tightening, the report should explain the cause, the expected short-term movement, and the action required.
How to prepare financial reports
Preparing financial reports is as much a communication task as it is an accounting task.
The numbers need to be accurate, but the report also needs to be clear, timely, and useful for decision-making.
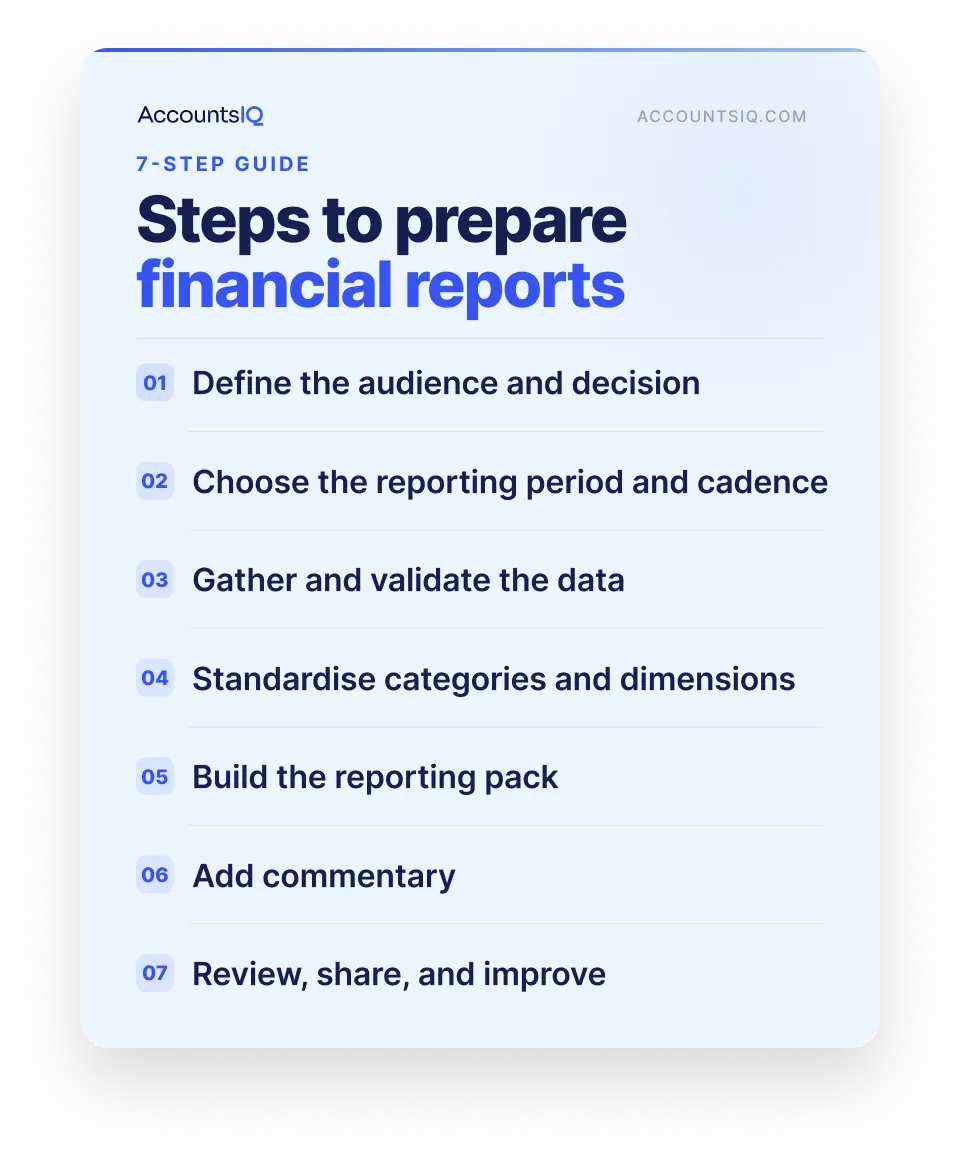
A practical financial reporting process has seven steps:
Step 1: Define the audience and decision
Start with the reader.
Ask who the report is for, what decision they need to make, and how much detail they need.
A common mistake is giving every audience the same pack. That usually creates too much detail for some readers and not enough for others.
Step 2: Choose the reporting period and cadence
Reporting cadence should match the decision.
Common examples include annual statutory reporting, quarterly board reporting, monthly management reporting, weekly cash flow reporting, and real-time dashboards.
The balance is speed and reliability. Reports shared too early can create rework. Reports shared too late lose operational value.
Step 3: Gather and validate the data
Typical reporting data comes from the general ledger, accounts payable, accounts receivable, payroll, expense management, bank data, CRM, and operational systems.
Finance should check for missing entries, coding errors, duplicate transactions, timing differences, reconciliation status, and intercompany balances.
Step 4: Standardise categories and dimensions
Useful reporting depends on consistent structure.
Standardise the chart of accounts, entities, departments, cost centres, projects, locations, product lines, and fund reporting where relevant.
Without standard dimensions, finance teams spend too much time reconciling differences between reports. This becomes especially visible during consolidation.
Step 5: Build the reporting pack
A useful financial reporting pack usually includes:
- Executive summary
- Profit and loss statement
- Balance sheet
- Cash flow statement
- Budget versus actual analysis
- Forecast update
- Entity or department analysis
- Risks and actions
Keep the structure clear. Leadership should be able to see the main issues quickly without digging through dozens of tabs.
Step 6: Add commentary
Commentary should explain:
- What happened
- Why it happened
- What happens next
Weak commentary repeats the number. Strong commentary explains the cause, impact, and next action.
Step 7: Review, share, and improve
Reporting should evolve.
Review ownership, approvals, version control, distribution lists, access permissions, feedback loops, and reports that are no longer useful.
Many finance teams keep producing reports nobody uses. Cutting low-value reporting gives finance more time for analysis, forecasting, and decision support.
Example monthly financial reporting pack
A monthly financial reporting pack should give leadership a clear view of performance, cash, risk, and decisions required.
A useful monthly pack usually includes:
The best monthly financial reporting packs are the ones that make the important points easy to find.
Leadership should be able to see what changed, what caused the movement, which variances matter, what decisions are required, and who owns the next action.
Common financial reporting challenges
Most finance teams know what good reporting should look like.
The challenge is keeping reporting clear, accurate, and useful as the business grows.
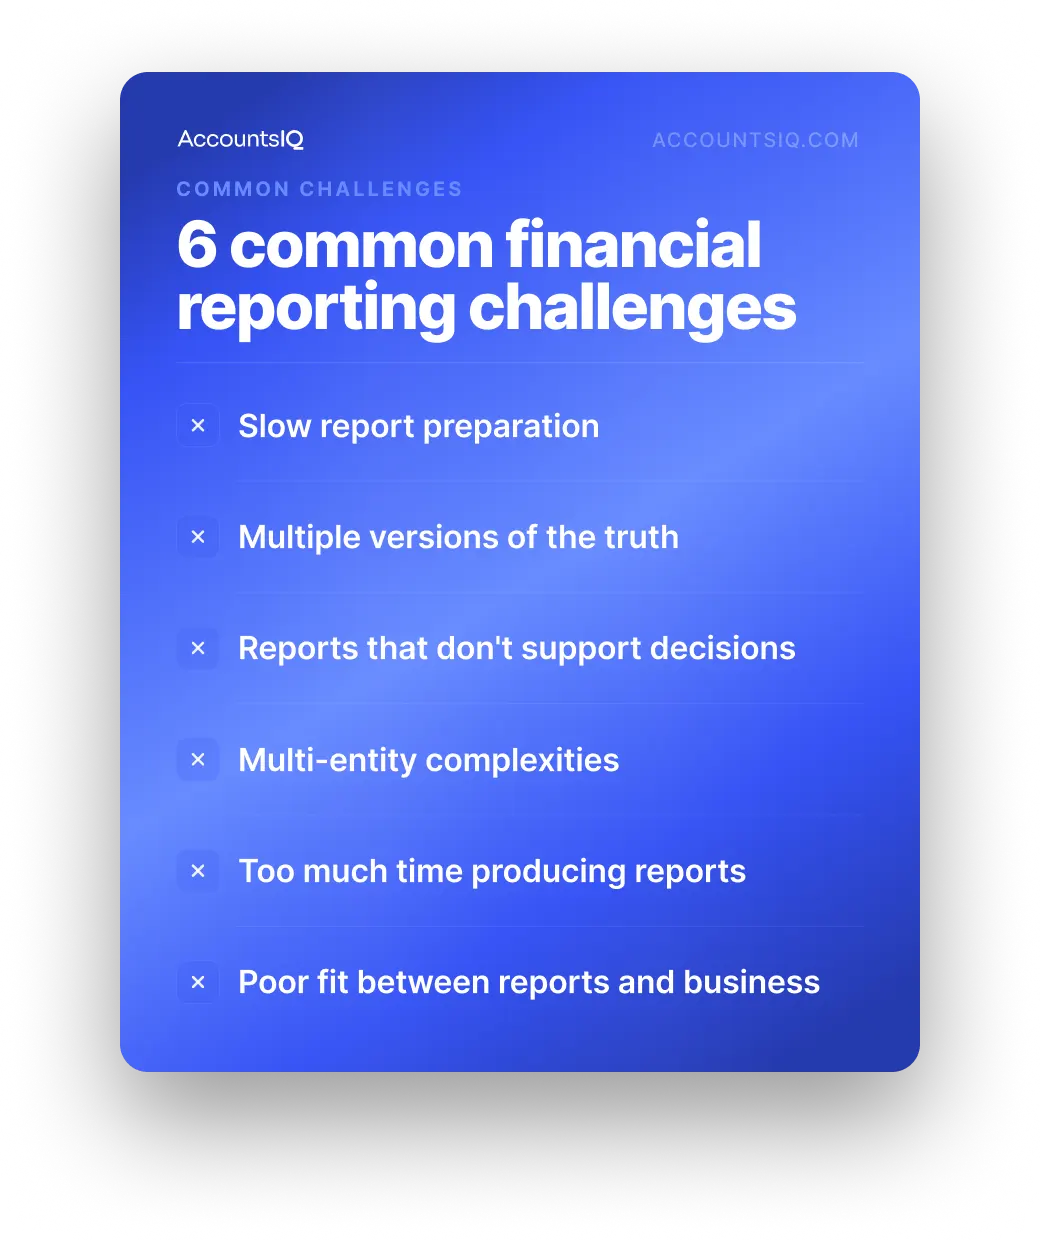
Common problems include:
- Slow report preparation: Manual exports, spreadsheet consolidation, late inputs, formatting work, and review rework all slow the reporting cycle.
- Multiple versions of the truth: Different spreadsheets, definitions, systems, and manual adjustments can lead teams to challenge the numbers instead of discussing performance.
- Accurate reports that don’t support decisions: Some packs are technically correct but too long, too historical, or too light on commentary to help leadership act.
- Multi-entity complexity: Intercompany balances, FX, separate ledgers, local reporting structures, and different close timelines make group reporting harder to manage manually.
- Too much time spent producing reports: When finance is moving data, correcting formulas, and managing versions, there’s less time for forecasting, scenario planning, and commercial analysis.
- Poor fit between reports and business structure: Leadership may need reporting by entity, department, project, product, or location, but the finance pack may still be built around account codes alone.
💡 If these signs are becoming familiar, your reporting process may have outgrown the systems behind it. That’s usually the point where finance teams need stronger reporting structures, cleaner consolidation, and more controlled access to the numbers.
Financial reporting automation: What should you automate?
Financial reporting automation is most useful when it removes the manual work that slows finance down.
It shouldn’t replace finance judgement. Reports still need review, commentary, challenge, and interpretation.
The best place to start is by asking: where is finance losing the most time?
The priority depends on where the reporting process is breaking down.
For some teams, the first issue is manual data collection. For multi-entity groups, consolidation is often the bigger bottleneck. For others, the problem is access: too many stakeholders asking finance for slightly different versions of the same report.
Once those bottlenecks are clear, the next question is whether your current finance system can support the reporting structure the business now needs.
How AccountsIQ supports better financial reporting
As finance operations become more complex, reporting needs to work harder.
That’s especially true for organisations managing multiple entities, currencies, departments, projects, funds, board packs, or investor reporting. At that point, spreadsheets and entry-level accounting software can become harder to control.
AccountsIQ is cloud accounting software built for growing finance teams that need stronger reporting without the complexity of a large ERP.
It supports better financial reporting through:
- Multi-entity consolidation for group reporting across entities, currencies, and structures
- Real-time financial reporting dashboards that update as transactions are posted
- Custom financial reports with drill-down to transaction-level detail
- Dimension-based reporting using analysis codes, such as department, region, or product
- Budgeting and forecasting tools for comparing actuals against plans and scenarios
- Business intelligence reporting through dashboards and integrations with Excel and Power BI
💡 Book a demo to see how AccountsIQ can support clearer financial reporting, consolidation, and forecasting.
Financial reporting FAQs
What is financial reporting in simple terms?
Financial reporting is the process of collecting, preparing and sharing financial information so an organisation can understand performance, manage risk, and make decisions.
It includes statutory accounts, management reports, dashboards, forecasts, and operational analysis.
What is the difference between financial reporting and financial statements?
Financial statements are formal accounting documents such as the balance sheet, profit and loss statement, and cash flow statement.
Financial reporting is broader. It includes preparing, reviewing, analysing, and sharing financial information across the business.
What is consolidated financial reporting?
Consolidated financial reporting combines financial information from multiple entities into a single group-level view.
It often includes intercompany eliminations, foreign exchange adjustments, and group-wide reporting analysis.
What are financial reporting best practices?
Financial reporting best practices include consistent data structures, clear ownership, reliable close processes, concise reporting packs, useful commentary, standardised KPIs, version control, and automation where appropriate.
The strongest reporting processes help leadership understand not only what happened, but what needs to happen next.